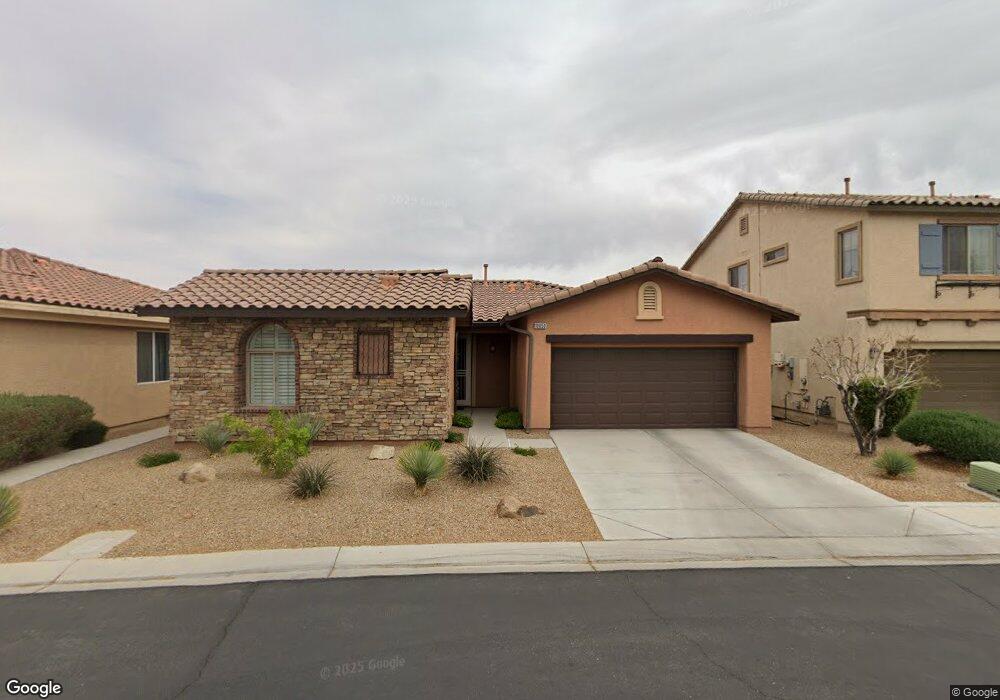
10650 Soaring Palm St Las Vegas, NV 89179
Mountains Edge NeighborhoodEstimated Value: $444,460 - $468,000
3
Beds
2
Baths
1,615
Sq Ft
$281/Sq Ft
Est. Value
About This Home
This home is located at 10650 Soaring Palm St, Las Vegas, NV 89179 and is currently estimated at $453,365, approximately $280 per square foot. 10650 Soaring Palm St is a home located in Clark County with nearby schools including Jones Blackhurst Elementary School, Desert Oasis High School, and Doral Academy Cactus.
Ownership History
Date
Name
Owned For
Owner Type
Purchase Details
Closed on
Nov 5, 2007
Sold by
Pardee Homes Of Nevada
Bought by
Fleig Youn O
Current Estimated Value
Home Financials for this Owner
Home Financials are based on the most recent Mortgage that was taken out on this home.
Original Mortgage
$148,860
Outstanding Balance
$94,039
Interest Rate
6.35%
Mortgage Type
Purchase Money Mortgage
Estimated Equity
$359,326
Create a Home Valuation Report for This Property
The Home Valuation Report is an in-depth analysis detailing your home's value as well as a comparison with similar homes in the area
Home Values in the Area
Average Home Value in this Area
Purchase History
| Date | Buyer | Sale Price | Title Company |
|---|---|---|---|
| Fleig Youn O | $273,860 | Chicago Title |
Source: Public Records
Mortgage History
| Date | Status | Borrower | Loan Amount |
|---|---|---|---|
| Open | Fleig Youn O | $148,860 |
Source: Public Records
Tax History Compared to Growth
Tax History
| Year | Tax Paid | Tax Assessment Tax Assessment Total Assessment is a certain percentage of the fair market value that is determined by local assessors to be the total taxable value of land and additions on the property. | Land | Improvement |
|---|---|---|---|---|
| 2025 | $2,217 | $123,296 | $40,250 | $83,046 |
| 2024 | $2,153 | $123,296 | $40,250 | $83,046 |
| 2023 | $2,153 | $118,536 | $40,250 | $78,286 |
| 2022 | $2,062 | $101,999 | $31,500 | $70,499 |
| 2021 | $2,002 | $96,508 | $29,750 | $66,758 |
| 2020 | $1,941 | $93,415 | $27,300 | $66,115 |
| 2019 | $1,884 | $90,313 | $25,550 | $64,763 |
| 2018 | $1,829 | $83,392 | $21,000 | $62,392 |
| 2017 | $2,282 | $77,799 | $21,000 | $56,799 |
| 2016 | $1,733 | $69,782 | $15,750 | $54,032 |
| 2015 | $1,729 | $61,099 | $12,250 | $48,849 |
| 2014 | $1,675 | $55,414 | $8,750 | $46,664 |
Source: Public Records
Map
Nearby Homes
- 10657 Cave Ridge St
- 10568 Peach Creek St
- 7468 Wellfleet Bay Ave
- 10743 Henesco Bay St
- 7409 Painted Mural Ave
- 10598 Cliff Lake St
- 7510 Perla Del Mar Ave
- 10604 Entrance Arch St
- 7513 Brisa Del Mar Ave
- 10479 Asana St
- 7497 Dequon Bay Ct
- 10739 Centerville Bay Ct
- 7312 Acopa Ave
- 7170 Sunny Countryside Ave
- 10730 Lightning Sky St
- 10751 Centerville Bay Ct
- 10498 Blue Rock St
- 7596 Eastham Bay Ave
- 7265 Sterling Rock Ave
- 0 W Erie Ave
- 10640 Soaring Palm St
- 10660 Soaring Palm St
- 10630 Soaring Palm St
- 10670 Soaring Palm St
- 7377 Horizon Rock Ave
- 10639 Soaring Palm St
- 10647 Peach Creek St
- 10620 Soaring Palm St
- 10680 Soaring Palm St
- 10655 Peach Creek St
- 10663 Peach Creek St
- 7387 Horizon Rock Ave
- 7387 Horizon Rock Ave
- 10629 Soaring Palm St
- 7374 Pepperbox Ave
- 10625 Peach Creek St
- 10671 Peach Creek St
- 10610 Soaring Palm St
- 10610 Soaring Palm St
- 10619 Soaring Palm St