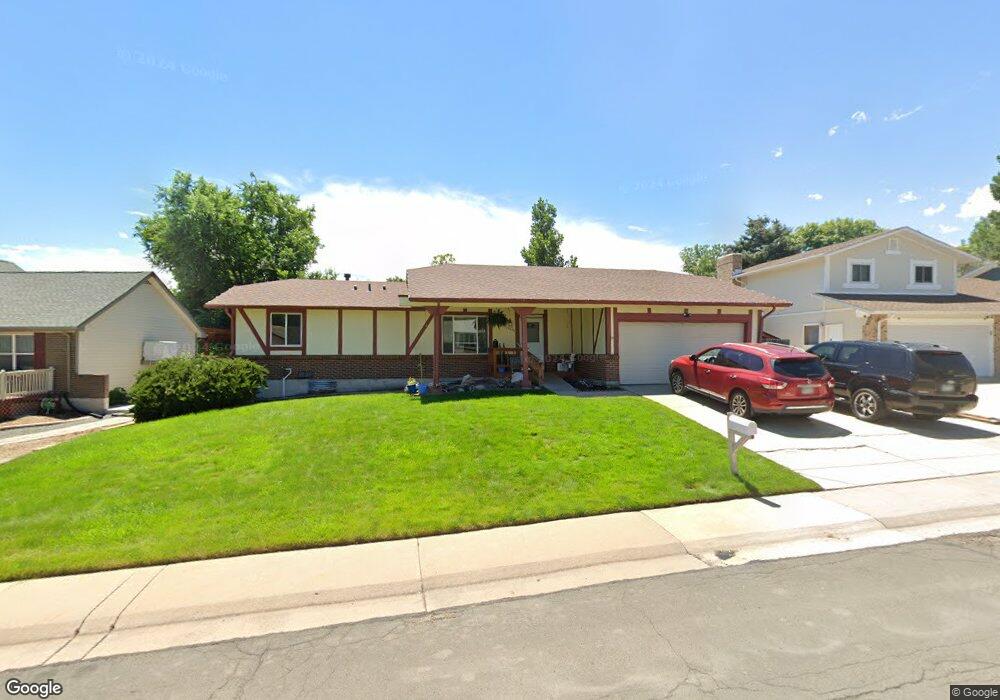
10650 W 102nd Place Westminster, CO 80021
Walnut Grove NeighborhoodEstimated Value: $548,000 - $632,000
5
Beds
2
Baths
2,545
Sq Ft
$232/Sq Ft
Est. Value
About This Home
This home is located at 10650 W 102nd Place, Westminster, CO 80021 and is currently estimated at $590,608, approximately $232 per square foot. 10650 W 102nd Place is a home located in Jefferson County with nearby schools including Lukas Elementary School, Wayne Carle Middle School, and Standley Lake High School.
Ownership History
Date
Name
Owned For
Owner Type
Purchase Details
Closed on
Sep 13, 2016
Sold by
Hp Colorado I Llc
Bought by
Hpa Borrower 2016 2 Llc
Current Estimated Value
Purchase Details
Closed on
Mar 24, 2016
Sold by
Laughlin James G and Laughlin Christine A
Bought by
Hp Colorado I Llc
Purchase Details
Closed on
Oct 27, 2015
Sold by
Mcclaflin Heidi
Bought by
Laughlin James G and Laughlin Christine A
Home Financials for this Owner
Home Financials are based on the most recent Mortgage that was taken out on this home.
Original Mortgage
$282,292
Interest Rate
3.75%
Mortgage Type
FHA
Purchase Details
Closed on
Sep 30, 2005
Sold by
Demarest John C and Demarest Diana Rae
Bought by
Mcclaflin Heidi
Home Financials for this Owner
Home Financials are based on the most recent Mortgage that was taken out on this home.
Original Mortgage
$179,900
Interest Rate
5.73%
Mortgage Type
Fannie Mae Freddie Mac
Create a Home Valuation Report for This Property
The Home Valuation Report is an in-depth analysis detailing your home's value as well as a comparison with similar homes in the area
Home Values in the Area
Average Home Value in this Area
Purchase History
| Date | Buyer | Sale Price | Title Company |
|---|---|---|---|
| Hpa Borrower 2016 2 Llc | -- | None Available | |
| Hp Colorado I Llc | $328,500 | Stewart Title | |
| Laughlin James G | $287,500 | Fidelity National Title Ins | |
| Mcclaflin Heidi | $259,900 | Chicago Title Co |
Source: Public Records
Mortgage History
| Date | Status | Borrower | Loan Amount |
|---|---|---|---|
| Previous Owner | Laughlin James G | $282,292 | |
| Previous Owner | Mcclaflin Heidi | $179,900 |
Source: Public Records
Tax History Compared to Growth
Tax History
| Year | Tax Paid | Tax Assessment Tax Assessment Total Assessment is a certain percentage of the fair market value that is determined by local assessors to be the total taxable value of land and additions on the property. | Land | Improvement |
|---|---|---|---|---|
| 2024 | $2,702 | $35,474 | $13,616 | $21,858 |
| 2023 | $2,702 | $35,474 | $13,616 | $21,858 |
| 2022 | $2,319 | $29,820 | $8,266 | $21,554 |
| 2021 | $2,353 | $30,678 | $8,504 | $22,174 |
| 2020 | $2,203 | $28,889 | $8,119 | $20,770 |
| 2019 | $2,168 | $28,889 | $8,119 | $20,770 |
| 2018 | $1,819 | $23,436 | $6,293 | $17,143 |
| 2017 | $1,629 | $23,436 | $6,293 | $17,143 |
| 2016 | $1,480 | $22,193 | $6,233 | $15,960 |
| 2015 | $1,441 | $22,193 | $6,233 | $15,960 |
| 2014 | $1,441 | $17,926 | $5,572 | $12,354 |
Source: Public Records
Map
Nearby Homes
- 10307 Owens St
- 10021 Miller St
- 10947 W 100th Dr
- 10017 Lewis St
- 11437 W 103rd Ave
- 10571 Parfet Ct
- 10610 Moore Ct
- 10665 Newcombe St
- 10411 Routt Ln
- 11476 W 105th Dr
- 11496 W 106th Way
- 10687 W 107th Ave
- 10741 Owens St
- 11221 W 107th Ave
- 10541 Routt St
- 10616 Kipling Way
- 14269 Currant St
- 14265 Currant St
- 14261 Currant St
- 14245 Currant St
- 10720 W 102nd Place
- 10640 W 102nd Place
- 10730 W 102nd Place
- 10630 W 102nd Place
- 10651 W 102nd Place
- 10651 W 102nd Ave
- 10721 W 102nd Place
- 10641 W 102nd Place
- 10641 W 102nd Ave
- 10711 W 102nd Ave
- 10731 W 102nd Place
- 10740 W 102nd Place
- 10620 W 102nd Place
- 10631 W 102nd Place
- 10631 W 102nd Ave
- 10721 W 102nd Ave
- 10660 W 103rd Ave
- 10720 W 103rd Ave
- 10650 W 103rd Ave
- 10741 W 102nd Place