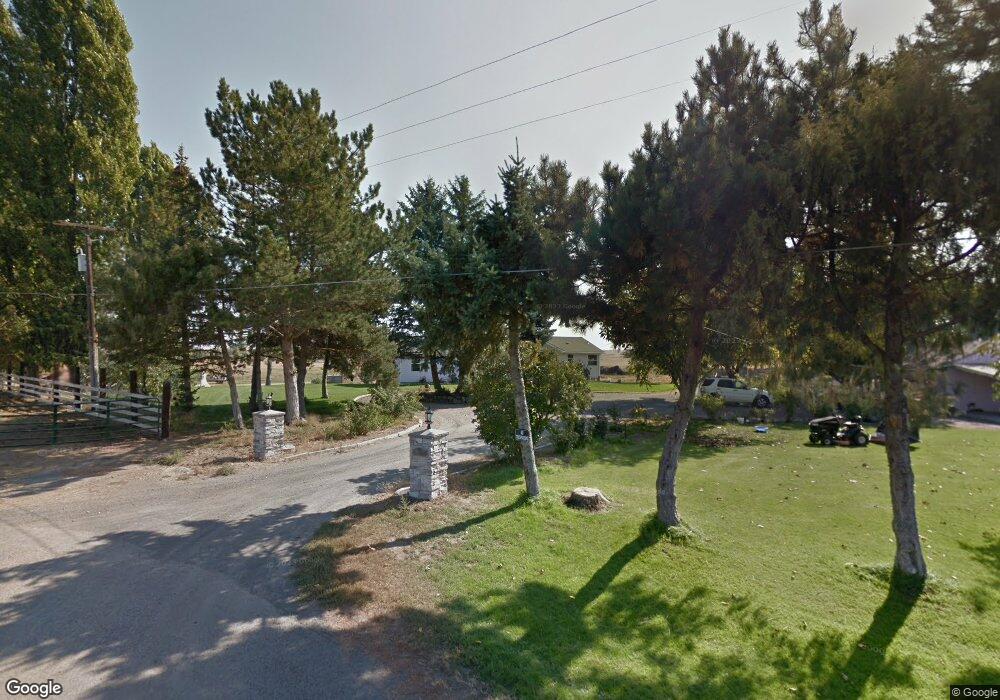
10651 Dune Lake Loop SE Moses Lake, WA 98837
Estimated Value: $535,000 - $762,000
3
Beds
2
Baths
2,610
Sq Ft
$250/Sq Ft
Est. Value
About This Home
This home is located at 10651 Dune Lake Loop SE, Moses Lake, WA 98837 and is currently estimated at $652,299, approximately $249 per square foot. 10651 Dune Lake Loop SE is a home with nearby schools including Sage Point Elementary School, Columbia Middle School, and Moses Lake High School.
Ownership History
Date
Name
Owned For
Owner Type
Purchase Details
Closed on
Apr 24, 2025
Sold by
Arriola James Manuel
Bought by
Arriola Janice L
Current Estimated Value
Purchase Details
Closed on
Mar 23, 2011
Sold by
Dunning Maria and Dunning Living Trust
Bought by
Arriola James M and Arriola Janice L
Home Financials for this Owner
Home Financials are based on the most recent Mortgage that was taken out on this home.
Original Mortgage
$170,091
Interest Rate
4.87%
Mortgage Type
FHA
Purchase Details
Closed on
Jul 1, 2010
Sold by
Arriola James M
Bought by
Arriola James M and Arriola Janice L
Home Financials for this Owner
Home Financials are based on the most recent Mortgage that was taken out on this home.
Original Mortgage
$161,662
Interest Rate
4.76%
Mortgage Type
Construction
Purchase Details
Closed on
Sep 14, 2005
Sold by
Dunning Arlo E and Dunning Living Trust
Bought by
Dunning Maria and Dunning Living Trust
Create a Home Valuation Report for This Property
The Home Valuation Report is an in-depth analysis detailing your home's value as well as a comparison with similar homes in the area
Home Values in the Area
Average Home Value in this Area
Purchase History
| Date | Buyer | Sale Price | Title Company |
|---|---|---|---|
| Arriola Janice L | -- | None Listed On Document | |
| Arriola James M | -- | Stewart Title | |
| Arriola James M | -- | Stewart-Security Title | |
| Dunning Maria | -- | None Available |
Source: Public Records
Mortgage History
| Date | Status | Borrower | Loan Amount |
|---|---|---|---|
| Previous Owner | Arriola James M | $170,091 | |
| Previous Owner | Arriola James M | $161,662 |
Source: Public Records
Tax History Compared to Growth
Tax History
| Year | Tax Paid | Tax Assessment Tax Assessment Total Assessment is a certain percentage of the fair market value that is determined by local assessors to be the total taxable value of land and additions on the property. | Land | Improvement |
|---|---|---|---|---|
| 2024 | $5,527 | $508,254 | $60,633 | $447,621 |
| 2023 | $4,784 | $416,515 | $60,905 | $355,610 |
| 2022 | $4,817 | $416,515 | $60,905 | $355,610 |
| 2021 | $3,948 | $416,515 | $60,905 | $355,610 |
| 2020 | $3,019 | $330,225 | $60,905 | $269,320 |
| 2019 | $3,128 | $238,170 | $89,880 | $148,290 |
| 2018 | $3,731 | $242,580 | $89,880 | $152,700 |
| 2017 | $3,957 | $273,960 | $89,880 | $184,080 |
| 2016 | $4,241 | $287,595 | $89,880 | $197,715 |
| 2013 | -- | $271,005 | $89,880 | $181,125 |
Source: Public Records
Map
Nearby Homes
- 9561 Baseline 5 Rd SE
- 395 Baseline 5 Rd SE
- 9460 Albert Way SE
- 9307 Albert Way SE
- 9343 Albert Way SE
- 9389 Baseline 1 NE
- 253 Karl Rd NE
- 9305 Naples St SE
- 331 Viewmont Dr SE
- 6 Pelican Place SE
- 527 Road I 6 NE
- TBD Stacy Dr SE
- 446 Viewmont Dr SE
- 0 Stacy Dr SE Unit NWM2409070
- 9747 Road 1 NE
- 8499 Dune Lake Rd SE
- 8084 Dune Lake Rd SE
- 0 NNA Yonezawa Blvd
- 2219 S Beaumont Dr
- 2117 Dilley Ave
- 547 Desert View Dr SE
- 10754 Dune Lake Loop SE
- 635 Desert View Dr SE
- 10755 Dune Lake Loop SE
- 10477 Dune Lake Loop SE
- 715 Desert View Dr SE
- 719 Sundance Rd SE
- 10285 Dune Lake Loop SE
- 10403 Dune Lake Loop SE
- 10820 Dune Lake Loop SE
- 721 Desert View Dr SE
- 10515 Dune Lake Loop SE
- 734 Desert View Dr SE
- 723 Desert View Dr SE
- 10893 Dune Lake Loop SE
- 775 Sundance Rd SE
- 511 Potato Hill Rd SE
- 10276 Dune Lake Loop SE
- 10105 Dune Lake Loop SE
- 814 Sundance Rd SE