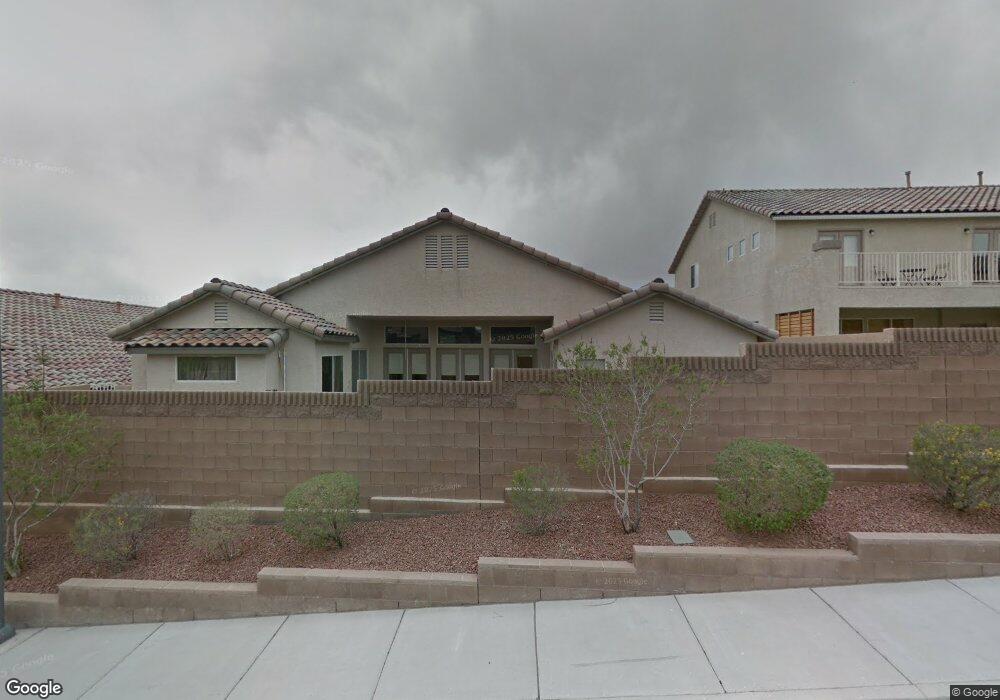
10653 Alpine Frost Ct Unit 6 Las Vegas, NV 89129
Lone Mountain NeighborhoodEstimated Value: $557,642 - $595,000
3
Beds
2
Baths
2,455
Sq Ft
$236/Sq Ft
Est. Value
About This Home
This home is located at 10653 Alpine Frost Ct Unit 6, Las Vegas, NV 89129 and is currently estimated at $580,411, approximately $236 per square foot. 10653 Alpine Frost Ct Unit 6 is a home located in Clark County with nearby schools including Eileen Conners Elementary School, Justice Myron E Leavitt Middle School, and Centennial High School.
Ownership History
Date
Name
Owned For
Owner Type
Purchase Details
Closed on
Feb 22, 2017
Sold by
Nunez Cesar and Nunez Maria
Bought by
Nunez Cesar and Nunez Maria
Current Estimated Value
Home Financials for this Owner
Home Financials are based on the most recent Mortgage that was taken out on this home.
Original Mortgage
$18,000
Outstanding Balance
$14,870
Interest Rate
4.12%
Mortgage Type
VA
Estimated Equity
$565,541
Purchase Details
Closed on
Mar 5, 2015
Sold by
Nunez Cesar and Nunez Maria F
Bought by
The Cesar And Maria Nunez Family Trust
Purchase Details
Closed on
May 31, 2002
Sold by
Stanpark Construction Company Inc
Bought by
Nunez Cesar and Nunez Maria F
Home Financials for this Owner
Home Financials are based on the most recent Mortgage that was taken out on this home.
Original Mortgage
$155,950
Outstanding Balance
$66,312
Interest Rate
6.89%
Estimated Equity
$514,099
Create a Home Valuation Report for This Property
The Home Valuation Report is an in-depth analysis detailing your home's value as well as a comparison with similar homes in the area
Home Values in the Area
Average Home Value in this Area
Purchase History
| Date | Buyer | Sale Price | Title Company |
|---|---|---|---|
| Nunez Cesar | -- | Title Source Inc | |
| Nunez Cesar | -- | Title Source Inc | |
| The Cesar And Maria Nunez Family Trust | -- | None Available | |
| Nunez Cesar | $203,915 | Land Title |
Source: Public Records
Mortgage History
| Date | Status | Borrower | Loan Amount |
|---|---|---|---|
| Open | Nunez Cesar | $18,000 | |
| Open | Nunez Cesar | $155,950 |
Source: Public Records
Tax History Compared to Growth
Tax History
| Year | Tax Paid | Tax Assessment Tax Assessment Total Assessment is a certain percentage of the fair market value that is determined by local assessors to be the total taxable value of land and additions on the property. | Land | Improvement |
|---|---|---|---|---|
| 2025 | $2,534 | $140,948 | $41,650 | $99,298 |
| 2024 | $2,461 | $140,948 | $41,650 | $99,298 |
| 2023 | $2,008 | $137,503 | $43,400 | $94,103 |
| 2022 | $2,390 | $122,171 | $36,400 | $85,771 |
| 2021 | $2,320 | $111,781 | $30,100 | $81,681 |
| 2020 | $2,249 | $112,176 | $31,150 | $81,026 |
| 2019 | $2,184 | $110,712 | $31,150 | $79,562 |
| 2018 | $2,032 | $98,499 | $22,050 | $76,449 |
| 2017 | $3,148 | $96,031 | $21,700 | $74,331 |
| 2016 | $2,008 | $92,138 | $15,050 | $77,088 |
| 2015 | $2,004 | $69,227 | $12,250 | $56,977 |
| 2014 | $1,945 | $57,652 | $9,800 | $47,852 |
Source: Public Records
Map
Nearby Homes
- 10642 Cliff Ridge Ave Unit 6
- 4612 Plum Button St
- 10701 Morning Harbor Ave Unit 7
- 10776 Princeton Bluff Ln
- 4576 Amazing View St
- 10563 Hedge View Ave
- 10405 Golden Reflection Ct Unit 3
- 4715 Amazing View St
- 10450 Gold Shadow Ave
- 10443 Kitty Joyce Ave
- 10531 Beckaville Ave
- 4337 Governors Hill St Unit 5
- 4307 Holleys Hill St
- 4337 Western Front St
- 4208 Holleys Hill St
- 10485 Canyon Cliff Ct Unit 5
- 10428 Snowdon Flat Ct
- 10550 W Alexander Rd Unit 2066
- 10550 W Alexander Rd Unit 1157
- 10550 W Alexander Rd Unit 2040
- 10649 Alpine Frost Ct Unit 6
- 10657 Alpine Frost Ct
- 10654 Early Dawn Ct
- 10650 Early Dawn Ct
- 10645 Alpine Frost Ct Unit 6
- 10661 Alpine Frost Ct
- 10658 Early Dawn Ct
- 10654 Alpine Frost Ct Unit 6
- 10650 Alpine Frost Ct Unit 6
- 10646 Early Dawn Ct
- 10658 Alpine Frost Ct Unit 6
- 10662 Alpine Frost Ct
- 10641 Alpine Frost Ct Unit 6
- 10646 Alpine Frost Ct
- 10662 Early Dawn Ct
- 10642 Early Dawn Ct
- 10642 Alpine Frost Ct
- 4636 Plum Button St
- 4642 Plum Button St
- 10649 Early Dawn Ct Unit 6