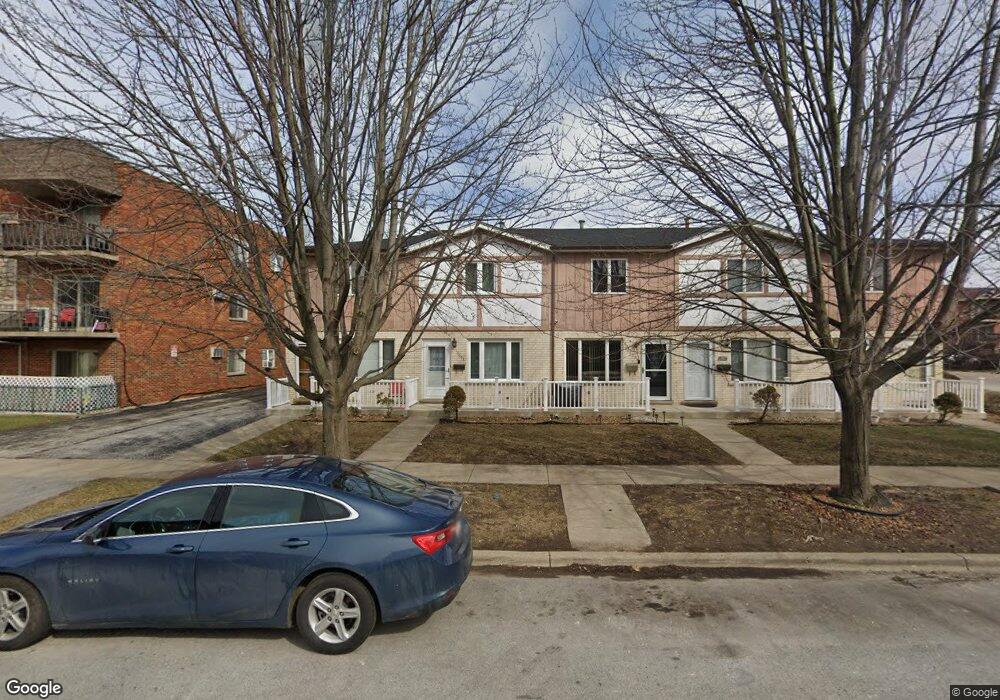
10653 Parkside Ave Unit 1 Chicago Ridge, IL 60415
Estimated Value: $206,000 - $232,000
2
Beds
2
Baths
1,124
Sq Ft
$195/Sq Ft
Est. Value
About This Home
This home is located at 10653 Parkside Ave Unit 1, Chicago Ridge, IL 60415 and is currently estimated at $219,092, approximately $194 per square foot. 10653 Parkside Ave Unit 1 is a home located in Cook County with nearby schools including Ridge Lawn Elementary School, Elden D Finley Jr High School, and Harold L. Richards High School.
Ownership History
Date
Name
Owned For
Owner Type
Purchase Details
Closed on
Jul 2, 2024
Sold by
Sivak Katherine A and Sivak Eric
Bought by
Abeja Hilda and Trejo Carolina
Current Estimated Value
Home Financials for this Owner
Home Financials are based on the most recent Mortgage that was taken out on this home.
Original Mortgage
$10,000
Interest Rate
7.03%
Mortgage Type
New Conventional
Purchase Details
Closed on
Sep 2, 2008
Sold by
Mcdermott Rachel E
Bought by
Sivak Katherine A
Home Financials for this Owner
Home Financials are based on the most recent Mortgage that was taken out on this home.
Original Mortgage
$130,000
Interest Rate
6.57%
Mortgage Type
Unknown
Purchase Details
Closed on
Dec 14, 2007
Sold by
Mitera Wojciech and Mitera Anna
Bought by
Mcdermott Rachel E
Home Financials for this Owner
Home Financials are based on the most recent Mortgage that was taken out on this home.
Original Mortgage
$153,000
Interest Rate
6.3%
Mortgage Type
Unknown
Create a Home Valuation Report for This Property
The Home Valuation Report is an in-depth analysis detailing your home's value as well as a comparison with similar homes in the area
Home Values in the Area
Average Home Value in this Area
Purchase History
| Date | Buyer | Sale Price | Title Company |
|---|---|---|---|
| Abeja Hilda | $205,000 | Fidelity National Title | |
| Sivak Katherine A | $170,000 | Multiple | |
| Mcdermott Rachel E | $170,000 | Cti |
Source: Public Records
Mortgage History
| Date | Status | Borrower | Loan Amount |
|---|---|---|---|
| Closed | Abeja Hilda | $10,000 | |
| Open | Abeja Hilda | $201,286 | |
| Previous Owner | Sivak Katherine A | $130,000 | |
| Previous Owner | Mcdermott Rachel E | $153,000 |
Source: Public Records
Tax History Compared to Growth
Tax History
| Year | Tax Paid | Tax Assessment Tax Assessment Total Assessment is a certain percentage of the fair market value that is determined by local assessors to be the total taxable value of land and additions on the property. | Land | Improvement |
|---|---|---|---|---|
| 2024 | $4,763 | $18,000 | $765 | $17,235 |
| 2023 | $5,232 | $18,000 | $765 | $17,235 |
| 2022 | $5,232 | $16,776 | $662 | $16,114 |
| 2021 | $5,040 | $16,774 | $661 | $16,113 |
| 2020 | $5,063 | $16,774 | $661 | $16,113 |
| 2019 | $4,016 | $13,715 | $599 | $13,116 |
| 2018 | $3,817 | $13,715 | $599 | $13,116 |
| 2017 | $3,846 | $13,715 | $599 | $13,116 |
| 2016 | $3,940 | $12,373 | $496 | $11,877 |
| 2015 | $3,815 | $12,373 | $496 | $11,877 |
| 2014 | $3,757 | $12,373 | $496 | $11,877 |
| 2013 | $3,830 | $13,617 | $496 | $13,121 |
Source: Public Records
Map
Nearby Homes
- 10710 Central Ave Unit 3D
- 10620 S Central Ave Unit 1A
- 10620 S Central Ave Unit 3A
- 10616 Central Ave Unit 1N
- 10634 Parkside Ave
- 10832 Massasoit Ave
- 5810 107th Court Way
- 10510 Parkside Ave Unit 1
- 10510 Parkside Ave Unit 7
- 10737 Long Ave
- 10420 Washington Ave
- 5633 Edge Lake Dr
- 5621 W 104th St Unit B2
- 5730 110th St
- 11000 Central Ave Unit 2C
- 5825 109th St
- 10745 Lockwood Ave
- 10360 Central Ave Unit 3C
- 10540 Lockwood Ave
- 10755 Mason Ave
- 10653 Parkside Ave
- 10653 Parkside Ave
- 10651 Parkside Ave
- 10651 Parkside Ave
- 10659 Parkside Ave
- 10659 Parkside Ave
- 10655 Parkside Ave
- 10655 Parkside Ave
- 10657 Parkside Ave
- 10657 Parkside Ave
- 10650 Central Ave
- 10656 Central Ave
- 10640 Central Ave
- 5630 107th St
- 5630 W 107th St Unit 2 bed
- 5630 W 107th St
- 10624 Central Ave Unit 2A
- 10624 Central Ave Unit 2B
- 10624 Central Ave Unit 1A
- 10624 Central Ave Unit 3A