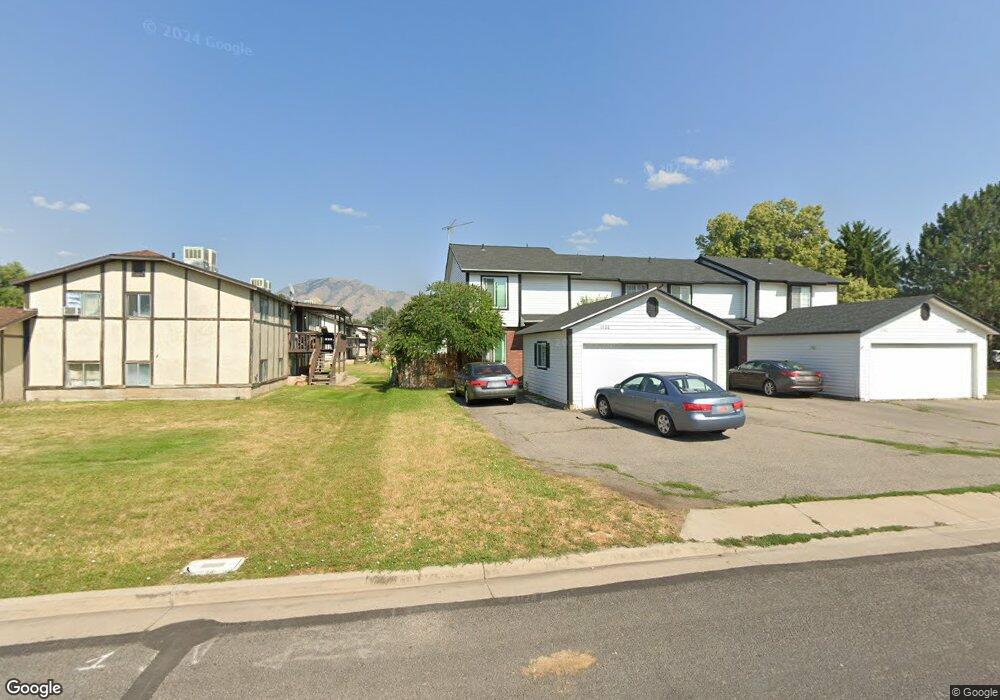
1066 N 375 W Logan, UT 84341
Bridger NeighborhoodEstimated Value: $262,474 - $302,000
3
Beds
2
Baths
1,152
Sq Ft
$237/Sq Ft
Est. Value
About This Home
This home is located at 1066 N 375 W, Logan, UT 84341 and is currently estimated at $273,369, approximately $237 per square foot. 1066 N 375 W is a home located in Cache County with nearby schools including Bridger School, Mount Logan Middle School, and Logan High School.
Ownership History
Date
Name
Owned For
Owner Type
Purchase Details
Closed on
Jan 22, 2024
Sold by
Taylor David and Taylor Marilyn
Bought by
Cabrera Camila B Aguilar and Cabrera Elsy L
Current Estimated Value
Home Financials for this Owner
Home Financials are based on the most recent Mortgage that was taken out on this home.
Original Mortgage
$255,290
Outstanding Balance
$249,929
Interest Rate
6.25%
Mortgage Type
FHA
Estimated Equity
$23,440
Purchase Details
Closed on
May 19, 2020
Sold by
Jrlo Group Lc
Bought by
Taylor David and Taylor Marilyn
Purchase Details
Closed on
May 12, 2020
Sold by
New Gardena Group Llc
Bought by
Jrlo Group Llc
Purchase Details
Closed on
Apr 16, 2020
Sold by
Cunningham James
Bought by
New Gardena Group Lc
Purchase Details
Closed on
Mar 23, 2016
Sold by
Hernandez Candice M and Hernandez Robert C
Bought by
Cunningham James
Home Financials for this Owner
Home Financials are based on the most recent Mortgage that was taken out on this home.
Original Mortgage
$115,706
Interest Rate
3.65%
Mortgage Type
VA
Purchase Details
Closed on
Jun 4, 2007
Sold by
Hernandez Candice M
Bought by
Hernandez Candice M and Hernandez Roberto C
Home Financials for this Owner
Home Financials are based on the most recent Mortgage that was taken out on this home.
Original Mortgage
$93,300
Interest Rate
6.12%
Mortgage Type
New Conventional
Create a Home Valuation Report for This Property
The Home Valuation Report is an in-depth analysis detailing your home's value as well as a comparison with similar homes in the area
Home Values in the Area
Average Home Value in this Area
Purchase History
| Date | Buyer | Sale Price | Title Company |
|---|---|---|---|
| Cabrera Camila B Aguilar | -- | None Listed On Document | |
| Taylor David | -- | American Secure Title Logan | |
| Jrlo Group Llc | -- | Advanced Title | |
| New Gardena Group Lc | -- | Advanced Title | |
| Cunningham James | -- | Cache Title Logan | |
| Hernandez Candice M | -- | Cache Title Company | |
| Hernandez Candice M | -- | Cache Title Company |
Source: Public Records
Mortgage History
| Date | Status | Borrower | Loan Amount |
|---|---|---|---|
| Open | Cabrera Camila B Aguilar | $255,290 | |
| Closed | Cabrera Camila B Aguilar | $15,317 | |
| Previous Owner | Cunningham James | $115,706 | |
| Previous Owner | Hernandez Candice M | $93,300 |
Source: Public Records
Tax History Compared to Growth
Tax History
| Year | Tax Paid | Tax Assessment Tax Assessment Total Assessment is a certain percentage of the fair market value that is determined by local assessors to be the total taxable value of land and additions on the property. | Land | Improvement |
|---|---|---|---|---|
| 2025 | $1,108 | $143,255 | $0 | $0 |
| 2024 | $1,172 | $146,760 | $0 | $0 |
| 2023 | $1,275 | $152,190 | $0 | $0 |
| 2022 | $1,143 | $127,440 | $0 | $0 |
| 2021 | $1,075 | $185,160 | $30,000 | $155,160 |
| 2020 | $1,028 | $159,300 | $30,000 | $129,300 |
| 2019 | $730 | $108,238 | $30,000 | $78,238 |
| 2018 | $711 | $96,304 | $30,000 | $66,304 |
| 2017 | $685 | $49,060 | $0 | $0 |
| 2016 | $710 | $49,060 | $0 | $0 |
| 2015 | $711 | $49,060 | $0 | $0 |
| 2014 | $636 | $48,515 | $0 | $0 |
| 2013 | $628 | $48,515 | $0 | $0 |
Source: Public Records
Map
Nearby Homes
- 1064 N 375 W
- 1062 N 375 W
- 370 W 1100 N
- 1060 N 375 W
- 363 W 1050 N
- 360 W 1100 N
- 371 W 1100 N Unit 12
- 1065 N 375 W Unit 2
- 339 W 1050 N
- 1055 N 375 W
- 1075 N 375 W
- 1075 N 375 W Unit 22
- 1075 N 375 W Unit 23
- 1075 N 375 W Unit 21
- 362 W 1050 N
- 1040 N 375 W
- 1089 N 375 W Unit 18
- 340 W 1100 N
- 367 W 1100 N
- 367 W 1100 N Unit 7