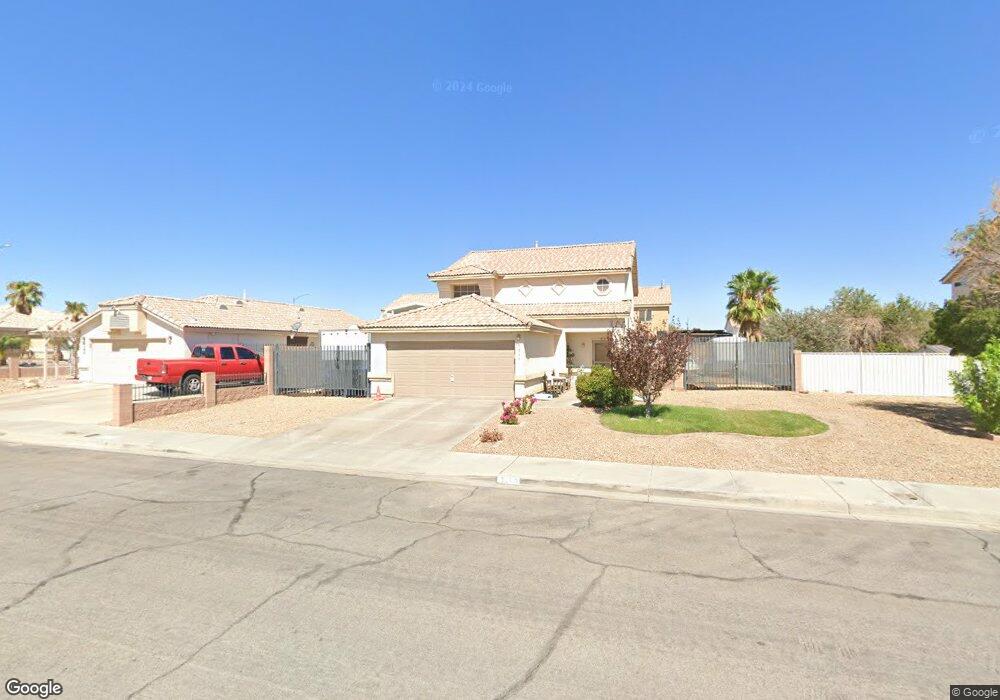
1066 Nordyke Ave Unit 2 Henderson, NV 89015
River Mountain NeighborhoodEstimated Value: $430,000 - $450,000
3
Beds
3
Baths
1,567
Sq Ft
$280/Sq Ft
Est. Value
About This Home
This home is located at 1066 Nordyke Ave Unit 2, Henderson, NV 89015 and is currently estimated at $439,178, approximately $280 per square foot. 1066 Nordyke Ave Unit 2 is a home located in Clark County with nearby schools including Sue H. Morrow Elementary School, B Mahlon Brown Academy of International Studies, and Basic Academy of International Studies.
Ownership History
Date
Name
Owned For
Owner Type
Purchase Details
Closed on
Jan 29, 2003
Sold by
Bell Joel T and Bell Jayne A
Bought by
Dierkes Steven P
Current Estimated Value
Home Financials for this Owner
Home Financials are based on the most recent Mortgage that was taken out on this home.
Original Mortgage
$161,994
Outstanding Balance
$69,479
Interest Rate
5.97%
Mortgage Type
FHA
Estimated Equity
$369,699
Purchase Details
Closed on
Apr 16, 2002
Sold by
Bivins Construction Co Inc
Bought by
Bell Joel T and Bell Jayne A
Home Financials for this Owner
Home Financials are based on the most recent Mortgage that was taken out on this home.
Original Mortgage
$149,291
Interest Rate
6.87%
Mortgage Type
FHA
Create a Home Valuation Report for This Property
The Home Valuation Report is an in-depth analysis detailing your home's value as well as a comparison with similar homes in the area
Home Values in the Area
Average Home Value in this Area
Purchase History
| Date | Buyer | Sale Price | Title Company |
|---|---|---|---|
| Dierkes Steven P | $165,000 | Nevada Title Company | |
| Bell Joel T | $151,400 | Nevada Title Company |
Source: Public Records
Mortgage History
| Date | Status | Borrower | Loan Amount |
|---|---|---|---|
| Open | Dierkes Steven P | $161,994 | |
| Previous Owner | Bell Joel T | $149,291 |
Source: Public Records
Tax History Compared to Growth
Tax History
| Year | Tax Paid | Tax Assessment Tax Assessment Total Assessment is a certain percentage of the fair market value that is determined by local assessors to be the total taxable value of land and additions on the property. | Land | Improvement |
|---|---|---|---|---|
| 2025 | $1,580 | $93,032 | $26,950 | $66,082 |
| 2024 | $1,534 | $93,032 | $26,950 | $66,082 |
| 2023 | $1,534 | $97,183 | $34,650 | $62,533 |
| 2022 | $1,490 | $84,691 | $27,650 | $57,041 |
| 2021 | $1,446 | $78,089 | $23,800 | $54,289 |
| 2020 | $1,401 | $77,526 | $23,800 | $53,726 |
| 2019 | $1,384 | $72,840 | $19,950 | $52,890 |
| 2018 | $1,321 | $66,892 | $16,100 | $50,792 |
| 2017 | $1,928 | $66,514 | $15,050 | $51,464 |
| 2016 | $1,237 | $54,095 | $8,400 | $45,695 |
| 2015 | $1,234 | $41,313 | $8,400 | $32,913 |
| 2014 | $1,198 | $41,366 | $7,000 | $34,366 |
Source: Public Records
Map
Nearby Homes
- 1024 Greyhound Ln
- 719 Tawney Eagle St
- 1063 Gurneys Eagle Ave
- 731 Tawney Eagle St
- 732 Goshawk St
- 730 Booted Eagle St
- 1082 Langston Ranch Ave
- 1001 Benton Ave
- 717 Triple Crown St
- 1041 Kennebunk Cir
- 698 S Racetrack Rd Unit 724
- 698 S Racetrack Rd Unit 1411
- 698 S Racetrack Rd Unit 322
- 698 S Racetrack Rd Unit 1521
- 698 S Racetrack Rd Unit 1621
- 1126 Langston Ranch Ave
- 1044 Kennebunk Cir
- 620 Camp Hill Rd
- 1008 Beaver Crest Terrace
- 1038 Beaver Crest Terrace
- 1068 Nordyke Ave
- 1064 Nordyke Ave
- 1065 African Eagle Ave
- 1063 African Eagle Ave
- 1067 African Eagle Ave
- 1070 Nordyke Ave Unit 2
- 1065 Nordyke Ave Unit 2
- 1067 Nordyke Ave
- 1063 Nordyke Ave
- 1069 African Eagle Ave Unit 2
- 707 Tawney Eagle St
- 705 Tawney Eagle Ave Unit 2
- 707 Tawney Eagle Ave Unit 2
- 1072 Nordyke Ave
- 1069 Nordyke Ave
- 703 Tawney Eagle St
- 703 Tawney Eagle Ave
- 709 Tawney Eagle Ave
- 1071 African Eagle Ave
- 711 Tawney Eagle Ave Unit 2