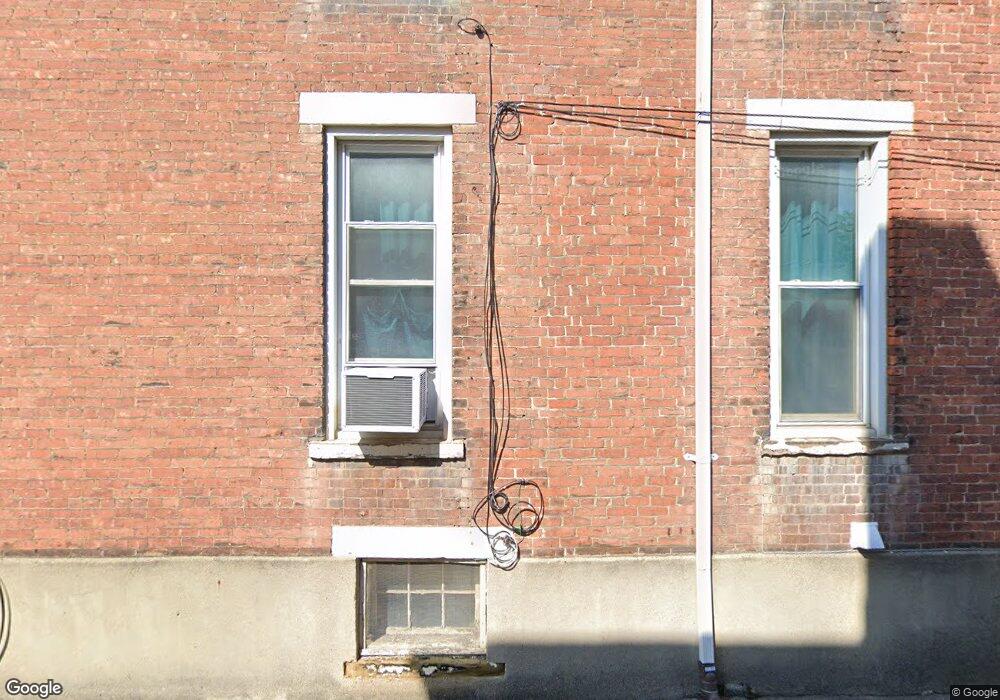
1066 Oak St Unit 68 Columbus, OH 43205
Olde Towne East NeighborhoodEstimated Value: $356,113 - $478,000
6
Beds
2
Baths
3,475
Sq Ft
$120/Sq Ft
Est. Value
About This Home
This home is located at 1066 Oak St Unit 68, Columbus, OH 43205 and is currently estimated at $418,528, approximately $120 per square foot. 1066 Oak St Unit 68 is a home located in Franklin County with nearby schools including Ohio Avenue Elementary School, Champion Middle School, and East High School.
Ownership History
Date
Name
Owned For
Owner Type
Purchase Details
Closed on
Dec 2, 2011
Sold by
Tarpoff Bo
Bought by
Floyd Deborah A
Current Estimated Value
Home Financials for this Owner
Home Financials are based on the most recent Mortgage that was taken out on this home.
Original Mortgage
$77,874
Outstanding Balance
$53,108
Interest Rate
4.25%
Mortgage Type
FHA
Estimated Equity
$365,420
Purchase Details
Closed on
May 14, 2009
Sold by
Hsbc Bank Usa Na
Bought by
Tarpoff Bo
Purchase Details
Closed on
Mar 18, 2009
Sold by
Fleming Julia C
Bought by
Hsbc Bank Usa Na
Purchase Details
Closed on
Oct 19, 2005
Sold by
Estate Of Johnnie Fleming
Bought by
Fleming Julia C
Home Financials for this Owner
Home Financials are based on the most recent Mortgage that was taken out on this home.
Original Mortgage
$175,700
Interest Rate
5.98%
Mortgage Type
Fannie Mae Freddie Mac
Purchase Details
Closed on
Jul 19, 1984
Bought by
Fleming Johnnie
Purchase Details
Closed on
Jan 1, 1979
Create a Home Valuation Report for This Property
The Home Valuation Report is an in-depth analysis detailing your home's value as well as a comparison with similar homes in the area
Home Values in the Area
Average Home Value in this Area
Purchase History
| Date | Buyer | Sale Price | Title Company |
|---|---|---|---|
| Floyd Deborah A | $79,900 | Bxamerititle | |
| Tarpoff Bo | $200,000 | Cornerston | |
| Hsbc Bank Usa Na | $58,000 | Independent | |
| Fleming Julia C | -- | American T | |
| Fleming Johnnie | $18,000 | -- | |
| -- | $9,000 | -- |
Source: Public Records
Mortgage History
| Date | Status | Borrower | Loan Amount |
|---|---|---|---|
| Open | Floyd Deborah A | $77,874 | |
| Previous Owner | Fleming Julia C | $175,700 |
Source: Public Records
Tax History
| Year | Tax Paid | Tax Assessment Tax Assessment Total Assessment is a certain percentage of the fair market value that is determined by local assessors to be the total taxable value of land and additions on the property. | Land | Improvement |
|---|---|---|---|---|
| 2025 | $4,369 | $95,340 | $33,390 | $61,950 |
| 2024 | $4,369 | $95,340 | $33,390 | $61,950 |
| 2023 | $4,315 | $95,340 | $33,390 | $61,950 |
| 2022 | $3,501 | $65,870 | $5,460 | $60,410 |
| 2021 | $3,507 | $65,870 | $5,460 | $60,410 |
| 2020 | $3,512 | $65,870 | $5,460 | $60,410 |
| 2019 | $3,278 | $52,720 | $4,380 | $48,340 |
| 2018 | $2,722 | $52,720 | $4,380 | $48,340 |
| 2017 | $3,278 | $52,720 | $4,380 | $48,340 |
| 2016 | $2,385 | $35,110 | $4,310 | $30,800 |
| 2015 | $2,172 | $35,110 | $4,310 | $30,800 |
| 2014 | $2,177 | $35,110 | $4,310 | $30,800 |
| 2013 | $993 | $31,920 | $3,920 | $28,000 |
Source: Public Records
Map
Nearby Homes
- 1070 Fair Ave
- 1035 Madison Ave
- 127 S Ohio Ave Unit 19
- 122 S Ohio Ave Unit 2
- 1076 Franklin Ave
- 155 S Ohio Ave
- 1093 Franklin Ave
- 972 Franklin Ave
- 1097 Franklin Ave
- 958 Franklin Ave
- 1109 Franklin Ave Unit 1111
- 122 S Champion Ave Unit 122-24-26
- 203-5 N 21st St Unit 203
- 1068 Bryden Rd Unit I
- 233 S Ohio Ave Unit 11
- 1021 Bryden Rd
- 192 S 19th St Unit 194
- 977 Bryden Rd
- 1179 Franklin Ave
- 1214 Madison Ave
Your Personal Tour Guide
Ask me questions while you tour the home.