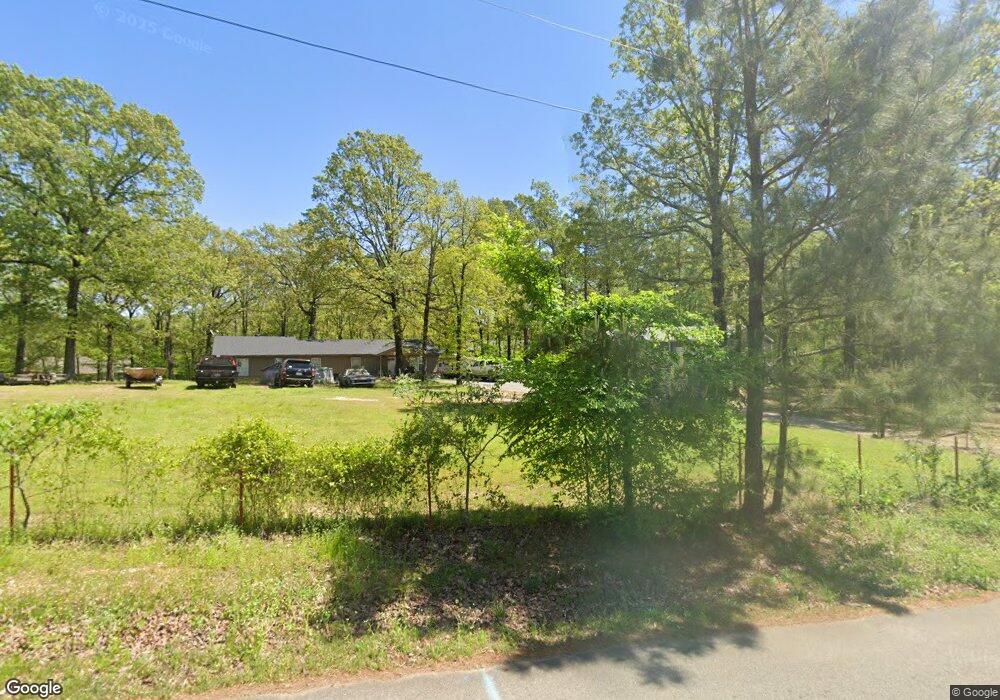
10662 Hinds Rd Benton, AR 72019
Estimated Value: $328,000 - $487,731
Studio
--
Bath
2,393
Sq Ft
$170/Sq Ft
Est. Value
About This Home
This home is located at 10662 Hinds Rd, Benton, AR 72019 and is currently estimated at $407,433, approximately $170 per square foot. 10662 Hinds Rd is a home with nearby schools including Salem Elementary School and Avilla Christian Academy.
Ownership History
Date
Name
Owned For
Owner Type
Purchase Details
Closed on
Apr 30, 2014
Sold by
Schrader Homes Llc
Bought by
Rickett Cory Martin and Rickett Shara Noel
Current Estimated Value
Home Financials for this Owner
Home Financials are based on the most recent Mortgage that was taken out on this home.
Original Mortgage
$216,030
Outstanding Balance
$164,778
Interest Rate
4.43%
Mortgage Type
New Conventional
Estimated Equity
$242,655
Purchase Details
Closed on
Nov 27, 2013
Sold by
Hall Roy W and Hall Diania E
Bought by
Schrader Homes Llc
Home Financials for this Owner
Home Financials are based on the most recent Mortgage that was taken out on this home.
Original Mortgage
$47,900
Interest Rate
4.14%
Mortgage Type
Future Advance Clause Open End Mortgage
Purchase Details
Closed on
Mar 29, 2012
Sold by
Huchingson Stephanie
Bought by
Roy And Diania E Hall Living Trust
Purchase Details
Closed on
Jun 17, 2004
Bought by
Huchingson S
Create a Home Valuation Report for This Property
The Home Valuation Report is an in-depth analysis detailing your home's value as well as a comparison with similar homes in the area
Purchase History
| Date | Buyer | Sale Price | Title Company |
|---|---|---|---|
| Rickett Cory Martin | $227,400 | First National Title Co | |
| Schrader Homes Llc | $47,900 | First National Title | |
| Hall Roy W | -- | None Available | |
| Roy And Diania E Hall Living Trust | -- | None Available | |
| Huchingson S | -- | -- | |
| Huchingson S | -- | -- |
Source: Public Records
Mortgage History
| Date | Status | Borrower | Loan Amount |
|---|---|---|---|
| Open | Rickett Cory Martin | $216,030 | |
| Previous Owner | Schrader Homes Llc | $47,900 |
Source: Public Records
Tax History
| Year | Tax Paid | Tax Assessment Tax Assessment Total Assessment is a certain percentage of the fair market value that is determined by local assessors to be the total taxable value of land and additions on the property. | Land | Improvement |
|---|---|---|---|---|
| 2025 | $3,371 | $75,522 | $23,903 | $51,619 |
| 2024 | $2,532 | $64,839 | $23,903 | $40,936 |
| 2023 | $2,272 | $64,839 | $23,903 | $40,936 |
| 2022 | $2,204 | $64,839 | $23,903 | $40,936 |
| 2021 | $2,095 | $46,930 | $10,550 | $36,380 |
| 2020 | $2,045 | $46,930 | $10,550 | $36,380 |
| 2019 | $2,045 | $46,930 | $10,550 | $36,380 |
| 2018 | $1,991 | $46,930 | $10,550 | $36,380 |
| 2017 | $1,887 | $46,930 | $10,550 | $36,380 |
| 2016 | $1,934 | $41,240 | $10,550 | $30,690 |
| 2015 | $1,934 | $41,240 | $10,550 | $30,690 |
| 2014 | $517 | $9,950 | $9,950 | $0 |
Source: Public Records
Map
Nearby Homes
- 10684 Hinds Rd
- 208 Middleton Place
- 288 Middleton Place Dr
- 280 Middleton Place Dr
- 200 Middleton Place Dr
- 11224 Thompson Dairy Rd
- 7008 Hannah Ln
- 9832 Congo Rd
- 9721 Congo Rd
- 301 Abrielle Ln
- 400 Kale Cove
- Lot 3 Abrielle Ln
- 11700 Avilla W
- 522 Valley Hill Rd
- 8616 Old Congo Rd
- Lot 2 Avilla Acres Subdivision
- 101 Liberty Trail
- Lot 3 Avilla Acres Subdivision
- 1528 Brookshire Dr
- 1105 Victory Ln
- 10690 Hinds Rd
- 10616 Hinds Rd
- 10598 Hinds Rd
- 10525 Jessica Ln
- 10682 Hinds Rd
- Lot 6 Hinds Rd
- Lot 1 Hinds Rd
- Lot 2 Hinds Rd
- Lot 10 Hinds Rd
- 10804 Hinds Rd
- 10651 Hinds Rd
- 10801 Hinds Rd
- 10425 Jessica Ln
- 1249 Bowen Dr
- 0 Hinds Unit 16018990
- 10609 Hinds Rd
- 1460 Steel Bridge Rd
- 1538 Steel Bridge Rd
- 0 Steel Bridge Unit 20034136
- 0 Steel Bridge Unit 17007409
Your Personal Tour Guide
Ask me questions while you tour the home.