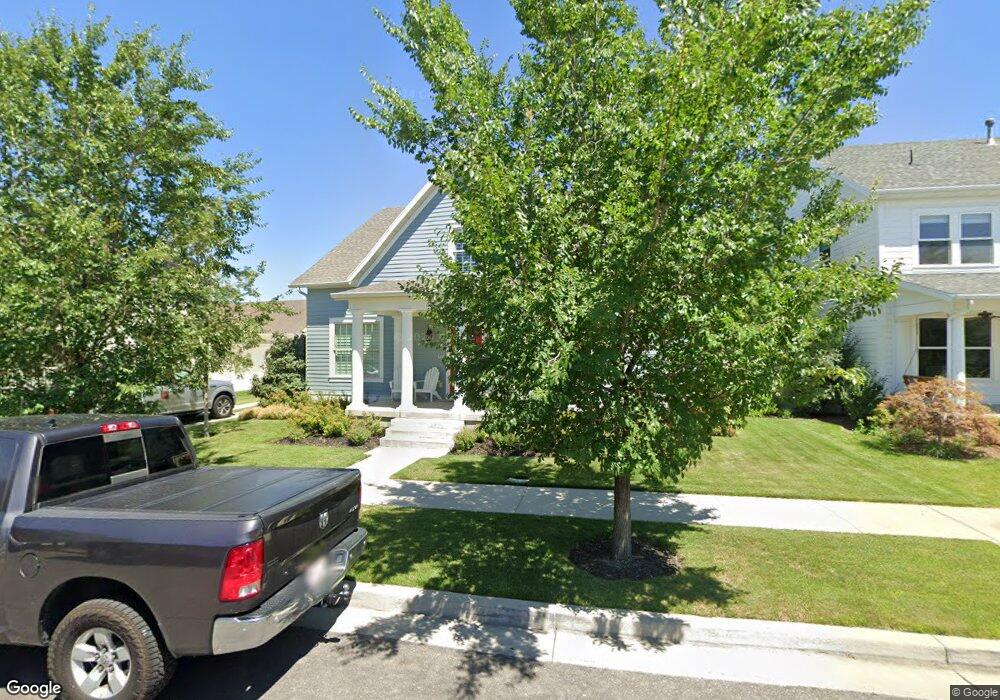
10669 S Cachuma Way South Jordan, UT 84009
Daybreak NeighborhoodEstimated Value: $727,449 - $889,000
4
Beds
3
Baths
2,821
Sq Ft
$280/Sq Ft
Est. Value
About This Home
This home is located at 10669 S Cachuma Way, South Jordan, UT 84009 and is currently estimated at $788,862, approximately $279 per square foot. 10669 S Cachuma Way is a home located in Salt Lake County with nearby schools including Eastlake Elementary School, Mountain Creek Middle School, and Herriman High School.
Ownership History
Date
Name
Owned For
Owner Type
Purchase Details
Closed on
Feb 2, 2021
Sold by
Stevenett Shaun B
Bought by
Stevenett Heather Atwood and Stevenett Shaun Bryan
Current Estimated Value
Purchase Details
Closed on
Oct 24, 2008
Sold by
Destination Homes At Daybreak Llc
Bought by
Stevenett Shaun B
Home Financials for this Owner
Home Financials are based on the most recent Mortgage that was taken out on this home.
Original Mortgage
$469,348
Outstanding Balance
$304,055
Interest Rate
5.9%
Mortgage Type
FHA
Estimated Equity
$484,807
Purchase Details
Closed on
Jun 10, 2008
Sold by
Kennecott Land Residential Development C
Bought by
Destination Homes At Daybreak Llc
Home Financials for this Owner
Home Financials are based on the most recent Mortgage that was taken out on this home.
Original Mortgage
$0
Interest Rate
5.99%
Mortgage Type
Unknown
Create a Home Valuation Report for This Property
The Home Valuation Report is an in-depth analysis detailing your home's value as well as a comparison with similar homes in the area
Home Values in the Area
Average Home Value in this Area
Purchase History
| Date | Buyer | Sale Price | Title Company |
|---|---|---|---|
| Stevenett Heather Atwood | -- | None Available | |
| Stevenett Shaun B | -- | Bonneville Superior Title | |
| Destination Homes At Daybreak Llc | -- | First American Title |
Source: Public Records
Mortgage History
| Date | Status | Borrower | Loan Amount |
|---|---|---|---|
| Open | Stevenett Shaun B | $469,348 | |
| Previous Owner | Destination Homes At Daybreak Llc | $0 | |
| Previous Owner | Destination Homes At Daybreak Llc | $373,200 |
Source: Public Records
Tax History Compared to Growth
Tax History
| Year | Tax Paid | Tax Assessment Tax Assessment Total Assessment is a certain percentage of the fair market value that is determined by local assessors to be the total taxable value of land and additions on the property. | Land | Improvement |
|---|---|---|---|---|
| 2025 | $3,767 | $722,700 | $118,800 | $603,900 |
| 2024 | $3,767 | $715,300 | $115,300 | $600,000 |
| 2023 | $3,920 | $702,200 | $112,000 | $590,200 |
| 2022 | $4,038 | $709,000 | $109,800 | $599,200 |
| 2021 | $3,142 | $506,100 | $84,600 | $421,500 |
| 2020 | $3,076 | $464,500 | $79,700 | $384,800 |
| 2019 | $2,908 | $431,600 | $79,700 | $351,900 |
| 2018 | $2,766 | $408,600 | $78,500 | $330,100 |
| 2017 | $2,653 | $384,000 | $78,500 | $305,500 |
| 2016 | $2,844 | $390,100 | $78,500 | $311,600 |
| 2015 | $2,838 | $378,400 | $95,000 | $283,400 |
| 2014 | $2,679 | $351,100 | $108,300 | $242,800 |
Source: Public Records
Map
Nearby Homes
- 11054 S Lake Run Rd
- 10711 S Navarro Way
- 10819 S Indigo Sky Way
- 4271 W Clarks Hill Dr
- 10674 Pine Shadow Rd
- 10674 S Pine Shadow Rd
- 4518 W Cave Run Ln
- 10426 S Millerton Dr
- 4507 W Talquin Ln
- 4438 W South Jordan Pkwy
- 4091 W Juniper Hills Dr
- 10896 S Poplar Brook Place
- 10566 S Oquirrh Lake Rd
- 11789 4000 W
- 4523 W South Jordan Pkwy
- 10934 Coralville Way
- 10984 Manitou Way
- 10459 S Sage Wood Way
- 4257 Lake Bridge Dr
- 4251 W Lake Bridge Dr
- 10657 Cachuma Way
- 10657 S Cachuma Way
- 10647 Cachuma Way
- 10652 S Vermillion Dr
- 10662 S Vermillion Dr
- 10679 Cachuma Way
- 10633 Cachuma Way
- 10689 S Cachuma Way
- 10647 S Cachuma Way
- 4304 W Pentenwell Ln
- 4304 W Pentenwell Ln
- 4308 Pentenwell Ln
- 4308 W Pentenwell Ln
- 10689 Cachuma Way
- 10672 S Vermillion Dr
- 10642 S Vermillion Dr
- 4303 W Pentenwell Ln
- 4314 W Pentenwell Ln
- 4314 W Pentenwell Ln
- 4318 W Pentenwell Ln