1066C Royle Rd Ladson, SC 29456
Estimated Value: $277,700 - $337,000
3
Beds
2
Baths
1,769
Sq Ft
$175/Sq Ft
Est. Value
About This Home
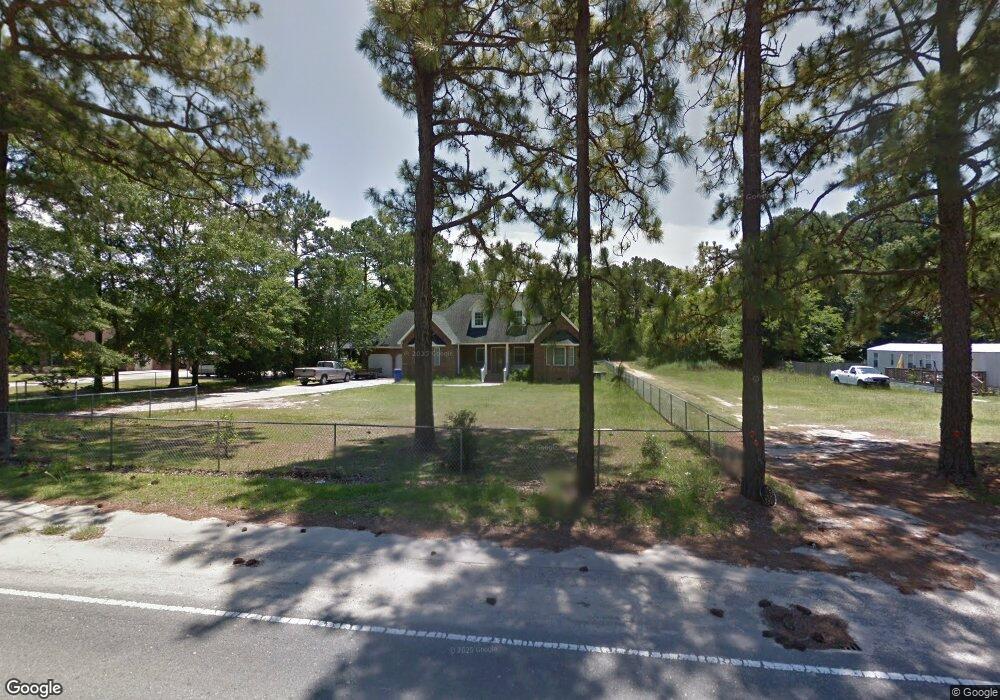
This home is located at 1066C Royle Rd, Ladson, SC 29456 and is currently estimated at $309,675, approximately $175 per square foot. 1066C Royle Rd is a home located in Berkeley County with nearby schools including Sangaree Elementary School, Sangaree Intermediate School, and Sangaree Middle School.
Ownership History
Date
Name
Owned For
Owner Type
Purchase Details
Closed on
Nov 17, 2008
Sold by
Goddard Kenneth O
Bought by
Goddard Kenneth O
Current Estimated Value
Purchase Details
Closed on
Aug 15, 2007
Sold by
Mccrackin Danielle Monica and Goddard Kenneth O
Bought by
Goddard Kenneth O
Purchase Details
Closed on
Dec 22, 2006
Sold by
Goddard Kenneth O and Goddard Ruth A
Bought by
Mccrackin Danielle Monica and Goddard Kenneth O
Purchase Details
Closed on
Nov 1, 2006
Sold by
Goddard Kenneth O and Goddard Ruth A
Bought by
Goddard Kenneth O and Mccrackin Danielle Monica
Purchase Details
Closed on
Apr 22, 2005
Sold by
Shelton Jessica J and Mckenzie Jessica Y
Bought by
Yohe Samuel L
Purchase Details
Closed on
May 14, 2004
Sold by
Hensley Rick and Hensley Christy Price
Bought by
Goddard Kenneth O and Goddard Ruth A
Create a Home Valuation Report for This Property
The Home Valuation Report is an in-depth analysis detailing your home's value as well as a comparison with similar homes in the area
Home Values in the Area
Average Home Value in this Area
Purchase History
| Date | Buyer | Sale Price | Title Company |
|---|---|---|---|
| Goddard Kenneth O | $110,000 | -- | |
| Goddard Kenneth O | $110,000 | -- | |
| Goddard Kenneth O | $110,333 | Attorney | |
| Mccrackin Danielle Monica | -- | None Available | |
| Goddard Kenneth O | -- | None Available | |
| Yohe Samuel L | -- | -- | |
| Goddard Kenneth O | $73,700 | -- |
Source: Public Records
Mortgage History
| Date | Status | Borrower | Loan Amount |
|---|---|---|---|
| Closed | Goddard Kenneth O | $0 |
Source: Public Records
Tax History
| Year | Tax Paid | Tax Assessment Tax Assessment Total Assessment is a certain percentage of the fair market value that is determined by local assessors to be the total taxable value of land and additions on the property. | Land | Improvement |
|---|---|---|---|---|
| 2025 | $800 | $148,252 | $45,625 | $102,627 |
| 2024 | $762 | $5,930 | $1,825 | $4,105 |
| 2023 | $762 | $5,930 | $1,825 | $4,105 |
| 2022 | $759 | $5,157 | $1,545 | $3,612 |
| 2021 | $776 | $5,160 | $1,545 | $3,612 |
| 2020 | $784 | $5,157 | $1,545 | $3,612 |
| 2019 | $779 | $5,157 | $1,545 | $3,612 |
| 2018 | $735 | $4,484 | $800 | $3,684 |
| 2017 | $656 | $4,484 | $800 | $3,684 |
| 2016 | $669 | $4,480 | $800 | $3,680 |
| 2015 | $624 | $4,480 | $800 | $3,680 |
| 2014 | $613 | $4,480 | $800 | $3,680 |
| 2013 | -- | $4,480 | $800 | $3,680 |
Source: Public Records
Map
Nearby Homes
- 105 Traders Station Rd
- 142 Fern Ct
- 310 Cohen Cir
- 106 Fern Ct
- 115 Broken Trail
- 109 Wisteria Ct
- 1009 Friartuck Trail
- 101 Hialeah Ct
- 106 Hialeah Ct
- 81 Red Bluff St
- 86 Red Bluff St
- 84 Red Bluff St
- 137 Paddock Way
- 2010 Cripplecreek Dr
- 201 Ash Ct
- 218 River Martin Ct
- 156 Lancashire Rd
- 482 Courtland Dr
- 0 Treeland Dr Unit 25010333
- 109 Marion Rd
Your Personal Tour Guide
Ask me questions while you tour the home.