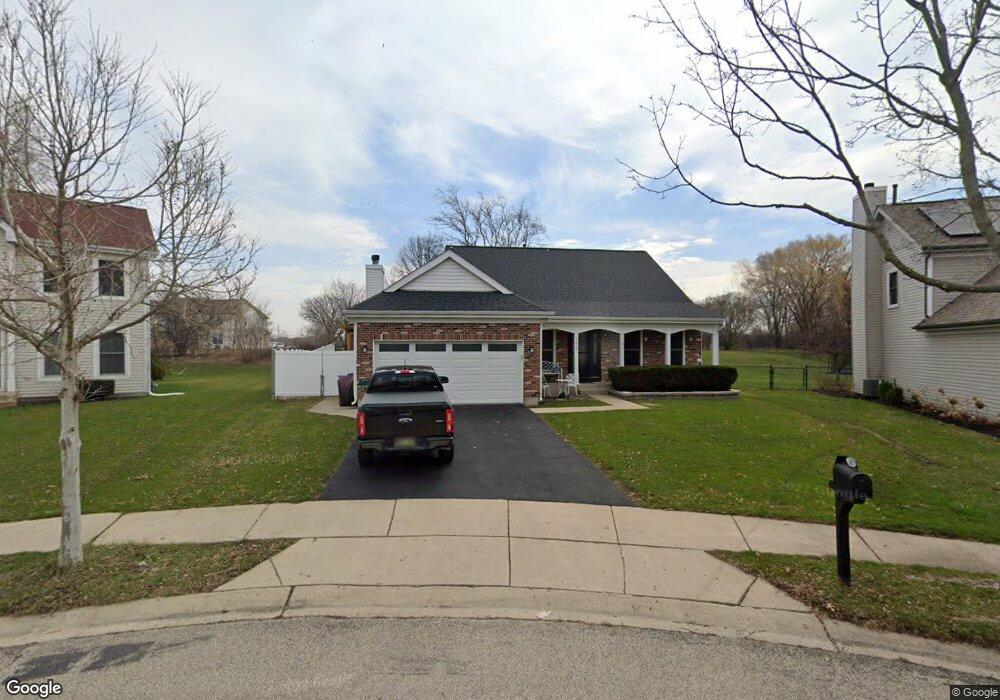
1067 Huron Ct Elgin, IL 60120
Cobblers Crossing NeighborhoodEstimated Value: $349,000 - $402,000
3
Beds
2
Baths
1,423
Sq Ft
$259/Sq Ft
Est. Value
About This Home
This home is located at 1067 Huron Ct, Elgin, IL 60120 and is currently estimated at $368,590, approximately $259 per square foot. 1067 Huron Ct is a home located in Cook County with nearby schools including Lincoln Elementary School, Larsen Middle School, and Elgin High School.
Ownership History
Date
Name
Owned For
Owner Type
Purchase Details
Closed on
Mar 19, 2021
Sold by
Stauffacher Steven J and Stauffacher Colleen
Bought by
Stauffacher Steven J and Stauffacher Colleen M
Current Estimated Value
Purchase Details
Closed on
Jan 8, 2007
Sold by
Stauffacher Steven J
Bought by
Stauffacher Steven J and Stauffacher Colleen
Purchase Details
Closed on
Jan 30, 2002
Sold by
Fox Annette M
Bought by
Stauffacher Steven J
Home Financials for this Owner
Home Financials are based on the most recent Mortgage that was taken out on this home.
Original Mortgage
$156,800
Outstanding Balance
$62,497
Interest Rate
7.14%
Estimated Equity
$306,093
Purchase Details
Closed on
Jun 28, 1994
Sold by
Cobblers Crossing Premier Ltd Prtnrshp
Bought by
Fox Annette M
Home Financials for this Owner
Home Financials are based on the most recent Mortgage that was taken out on this home.
Original Mortgage
$125,000
Interest Rate
7.5%
Create a Home Valuation Report for This Property
The Home Valuation Report is an in-depth analysis detailing your home's value as well as a comparison with similar homes in the area
Home Values in the Area
Average Home Value in this Area
Purchase History
| Date | Buyer | Sale Price | Title Company |
|---|---|---|---|
| Stauffacher Steven J | -- | Attorney | |
| Stauffacher Steven J | -- | None Available | |
| Stauffacher Steven J | $196,000 | -- | |
| Fox Annette M | $157,500 | Intercounty Title |
Source: Public Records
Mortgage History
| Date | Status | Borrower | Loan Amount |
|---|---|---|---|
| Open | Stauffacher Steven J | $156,800 | |
| Previous Owner | Fox Annette M | $125,000 |
Source: Public Records
Tax History
| Year | Tax Paid | Tax Assessment Tax Assessment Total Assessment is a certain percentage of the fair market value that is determined by local assessors to be the total taxable value of land and additions on the property. | Land | Improvement |
|---|---|---|---|---|
| 2025 | $6,529 | $31,000 | $7,458 | $23,542 |
| 2024 | $6,529 | $26,000 | $6,526 | $19,474 |
| 2023 | $6,316 | $26,000 | $6,526 | $19,474 |
| 2022 | $6,316 | $26,000 | $6,526 | $19,474 |
| 2021 | $6,358 | $21,781 | $4,195 | $17,586 |
| 2020 | $6,396 | $21,781 | $4,195 | $17,586 |
| 2019 | $6,367 | $24,202 | $4,195 | $20,007 |
| 2018 | $6,245 | $21,815 | $3,729 | $18,086 |
| 2017 | $6,245 | $21,815 | $3,729 | $18,086 |
| 2016 | $6,156 | $21,815 | $3,729 | $18,086 |
| 2015 | $5,934 | $19,512 | $3,263 | $16,249 |
| 2014 | $5,766 | $19,512 | $3,263 | $16,249 |
| 2013 | $5,556 | $19,512 | $3,263 | $16,249 |
Source: Public Records
Map
Nearby Homes
- 1200 Deep Woods Dr
- 860 Parkway Ave
- 1190 Alpine Ln
- 796 Parkway Ave
- 6131 Canterbury Ln Unit 281
- 1210 Mohawk Dr
- Vacant Lot Parcel 1 Congdon Ave
- 6073 Canterbury Ln Unit 335
- 694 Parkway Ave
- 1812 Kelberg Ave Unit 482
- 1409 Dundee Ave
- 2224 Amelia Ln
- 616 Glenwood Ave
- 1870 Hampshire Dr
- 2221 Edgartown Ln
- 501 Glenwood Trail
- 5815 Fairview Ln
- 1503 Kenneth Cir
- 1089 Quaker Hill Ct Unit 711
- 683 Columbia Ave
Your Personal Tour Guide
Ask me questions while you tour the home.