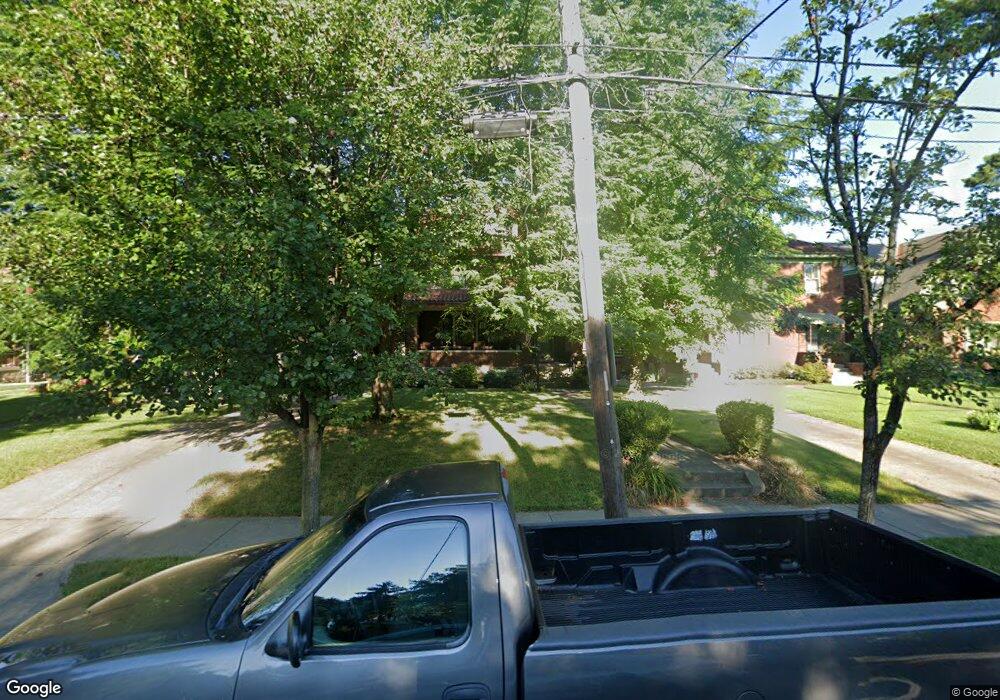
1067 Overlook Ave Cincinnati, OH 45238
West Price Hill NeighborhoodEstimated Value: $279,005 - $361,000
4
Beds
2
Baths
2,402
Sq Ft
$129/Sq Ft
Est. Value
About This Home
This home is located at 1067 Overlook Ave, Cincinnati, OH 45238 and is currently estimated at $309,501, approximately $128 per square foot. 1067 Overlook Ave is a home located in Hamilton County with nearby schools including Carson School, Gilbert A. Dater High School, and Western Hills High School.
Ownership History
Date
Name
Owned For
Owner Type
Purchase Details
Closed on
Oct 31, 2014
Sold by
Williams Shane L and Williams Maria C
Bought by
Hebenbstreit Christopher R and Slatt Elizabeth A
Current Estimated Value
Home Financials for this Owner
Home Financials are based on the most recent Mortgage that was taken out on this home.
Original Mortgage
$153,000
Outstanding Balance
$116,758
Interest Rate
4.21%
Mortgage Type
New Conventional
Estimated Equity
$192,743
Purchase Details
Closed on
Jan 18, 2001
Sold by
Johnson Jennifer D and Kruger Michael
Bought by
Williams Shane L
Home Financials for this Owner
Home Financials are based on the most recent Mortgage that was taken out on this home.
Original Mortgage
$133,500
Interest Rate
7.58%
Create a Home Valuation Report for This Property
The Home Valuation Report is an in-depth analysis detailing your home's value as well as a comparison with similar homes in the area
Home Values in the Area
Average Home Value in this Area
Purchase History
| Date | Buyer | Sale Price | Title Company |
|---|---|---|---|
| Hebenbstreit Christopher R | $170,000 | Attorney | |
| Williams Shane L | $168,500 | L & D Title Agency Inc |
Source: Public Records
Mortgage History
| Date | Status | Borrower | Loan Amount |
|---|---|---|---|
| Open | Hebenbstreit Christopher R | $153,000 | |
| Previous Owner | Williams Shane L | $133,500 |
Source: Public Records
Tax History
| Year | Tax Paid | Tax Assessment Tax Assessment Total Assessment is a certain percentage of the fair market value that is determined by local assessors to be the total taxable value of land and additions on the property. | Land | Improvement |
|---|---|---|---|---|
| 2025 | $4,718 | $76,409 | $6,241 | $70,168 |
| 2023 | $4,680 | $76,409 | $6,241 | $70,168 |
| 2022 | $4,469 | $65,451 | $6,199 | $59,252 |
| 2021 | $4,305 | $65,451 | $6,199 | $59,252 |
| 2020 | $4,425 | $65,451 | $6,199 | $59,252 |
| 2019 | $4,400 | $59,500 | $5,635 | $53,865 |
| 2018 | $4,407 | $59,500 | $5,635 | $53,865 |
| 2017 | $4,190 | $59,500 | $5,635 | $53,865 |
| 2016 | $3,175 | $44,405 | $6,020 | $38,385 |
| 2015 | $2,861 | $44,405 | $6,020 | $38,385 |
| 2014 | $2,881 | $44,405 | $6,020 | $38,385 |
| 2013 | $3,330 | $50,464 | $6,843 | $43,621 |
Source: Public Records
Map
Nearby Homes
- 1086 Benz Ave
- 4764 Dale Ave
- 1059 Lockman Ave
- 815 Pedretti Ave
- 4758 Glenway Ave
- 1092 Morado Dr
- 4458 W 8th St
- 4419 Ridgeview Ave
- 4526 Clearview Ave
- 4452 Carnation Ave
- 4614 Midland Ave
- 4340 Eighth St W
- 4965 Glenway Ave
- 1023 Woodbriar Ln
- 4334 W 8th St
- 4305 Saint Lawrence Ave
- 1031 Schiff Ave
- 5152 Highview Dr
- 1026 Schiff Ave
- 5114 Cleves Warsaw Pike
- 1063 Overlook Ave
- 1069 Overlook Ave
- 1059 Overlook Ave
- 1075 Overlook Ave
- 1055 Overlook Ave
- 1051 Overlook Ave
- 1062 Coronado Ave
- 1066 Coronado Ave
- 1103 Overlook Ave
- 1074 Coronado Ave
- 1066 Overlook Ave
- 1064 Overlook Ave
- 1070 Overlook Ave
- 1101 Rulison Ave
- 1045 Overlook Ave
- 1046 Coronado Ave
- 1062 Overlook Ave
- 1054 Coronado Ave
- 1058 Overlook Ave
- 1042 Coronado Ave
Your Personal Tour Guide
Ask me questions while you tour the home.