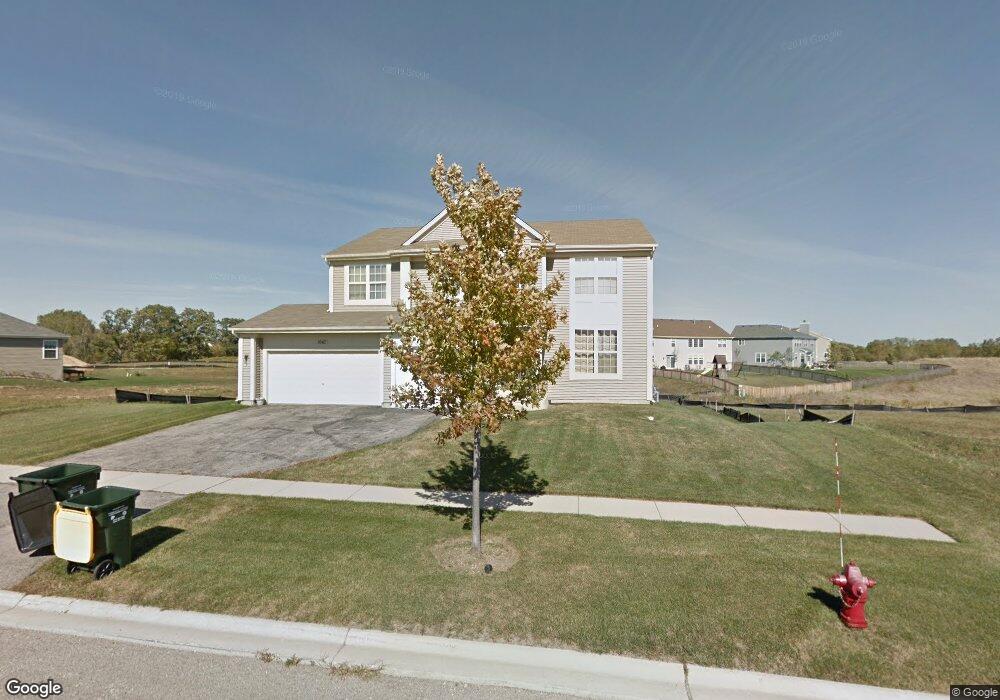
1067 Waterfront Ln Pingree Grove, IL 60140
Estimated Value: $473,000 - $495,262
5
Beds
4
Baths
2,835
Sq Ft
$171/Sq Ft
Est. Value
About This Home
This home is located at 1067 Waterfront Ln, Pingree Grove, IL 60140 and is currently estimated at $484,566, approximately $170 per square foot. 1067 Waterfront Ln is a home located in Kane County with nearby schools including Hampshire Middle School, Hampshire High School, and Cambridge Lakes Charter School.
Ownership History
Date
Name
Owned For
Owner Type
Purchase Details
Closed on
Jul 29, 2010
Sold by
Federal Home Loan Mortgage Corporation
Bought by
Kazlauskas Joseph A and Kazlauskas Janet L
Current Estimated Value
Home Financials for this Owner
Home Financials are based on the most recent Mortgage that was taken out on this home.
Original Mortgage
$202,250
Outstanding Balance
$134,314
Interest Rate
4.63%
Mortgage Type
FHA
Estimated Equity
$350,252
Purchase Details
Closed on
Feb 22, 2010
Sold by
Nava Jesus J
Bought by
Federal Home Loan Mortgage Corp
Purchase Details
Closed on
Jun 7, 2007
Sold by
Drh Cambridge Homes Inc
Bought by
Perez Leobardo and Nava Jesus J
Home Financials for this Owner
Home Financials are based on the most recent Mortgage that was taken out on this home.
Original Mortgage
$345,448
Interest Rate
6.2%
Mortgage Type
Purchase Money Mortgage
Create a Home Valuation Report for This Property
The Home Valuation Report is an in-depth analysis detailing your home's value as well as a comparison with similar homes in the area
Home Values in the Area
Average Home Value in this Area
Purchase History
| Date | Buyer | Sale Price | Title Company |
|---|---|---|---|
| Kazlauskas Joseph A | $205,000 | Attorneys Title Guaranty Fun | |
| Federal Home Loan Mortgage Corp | -- | None Available | |
| Perez Leobardo | $364,000 | First American Title |
Source: Public Records
Mortgage History
| Date | Status | Borrower | Loan Amount |
|---|---|---|---|
| Open | Kazlauskas Joseph A | $202,250 | |
| Previous Owner | Perez Leobardo | $345,448 |
Source: Public Records
Tax History Compared to Growth
Tax History
| Year | Tax Paid | Tax Assessment Tax Assessment Total Assessment is a certain percentage of the fair market value that is determined by local assessors to be the total taxable value of land and additions on the property. | Land | Improvement |
|---|---|---|---|---|
| 2024 | $10,895 | $144,448 | $30,777 | $113,671 |
| 2023 | $10,571 | $130,627 | $27,832 | $102,795 |
| 2022 | $10,195 | $120,438 | $25,661 | $94,777 |
| 2021 | $9,940 | $113,279 | $24,136 | $89,143 |
| 2020 | $9,770 | $110,387 | $23,520 | $86,867 |
| 2019 | $9,562 | $105,948 | $22,574 | $83,374 |
| 2018 | $9,311 | $99,435 | $21,186 | $78,249 |
| 2017 | $9,144 | $94,691 | $20,175 | $74,516 |
| 2016 | $9,118 | $90,148 | $19,207 | $70,941 |
| 2015 | -- | $85,141 | $18,140 | $67,001 |
| 2014 | -- | $85,567 | $20,566 | $65,001 |
| 2013 | -- | $87,135 | $20,943 | $66,192 |
Source: Public Records
Map
Nearby Homes
- 1255 Waterfront Ln
- 410 Brookhaven Trail
- 460 Lancaster Dr
- 562 Lancaster Dr
- Lot 019 Old Stage Rd
- 163 Maryland Ln
- 14N515 Highland Ave
- 700 Brighton Dr
- 898 Emerald Dr
- 560 Canterbury Ln
- 955 Emerald Dr
- 932 Clover Ln
- 672 N Falls Cir
- 01 Route 72
- 3301 U S 20
- 1157 Clearwater Dr
- 870 Prescott Ln
- 920 Prescott Ln
- 1286 Newport Cir
- 1173 Sonoma Ct
- 1075 Waterfront Ln
- 1059 Waterfront Ln
- 1051 Waterfront Ln
- 35 Loon Lake Ct
- 1099 Waterfront Ln
- 1068 Waterfront Ln
- 45 Loon Lake Ct
- 1043 Waterfront Ln
- 55 Loon Lake Ct
- 1123 Waterfront Ln
- 25 Loon Lake Ct
- 4 Catamaran Cir
- 1082 Waterfront Ln
- 18 Catamaran Cir
- 65 Loon Lake Ct
- 1096 Waterfront Ln
- 1013 Catamaran Cir
- 32 Catamaran Cir
- 1110 Waterfront Ln
- 1124 Waterfront Ln