Estimated Value: $483,000 - $550,000
3
Beds
3
Baths
2,016
Sq Ft
$253/Sq Ft
Est. Value
About This Home
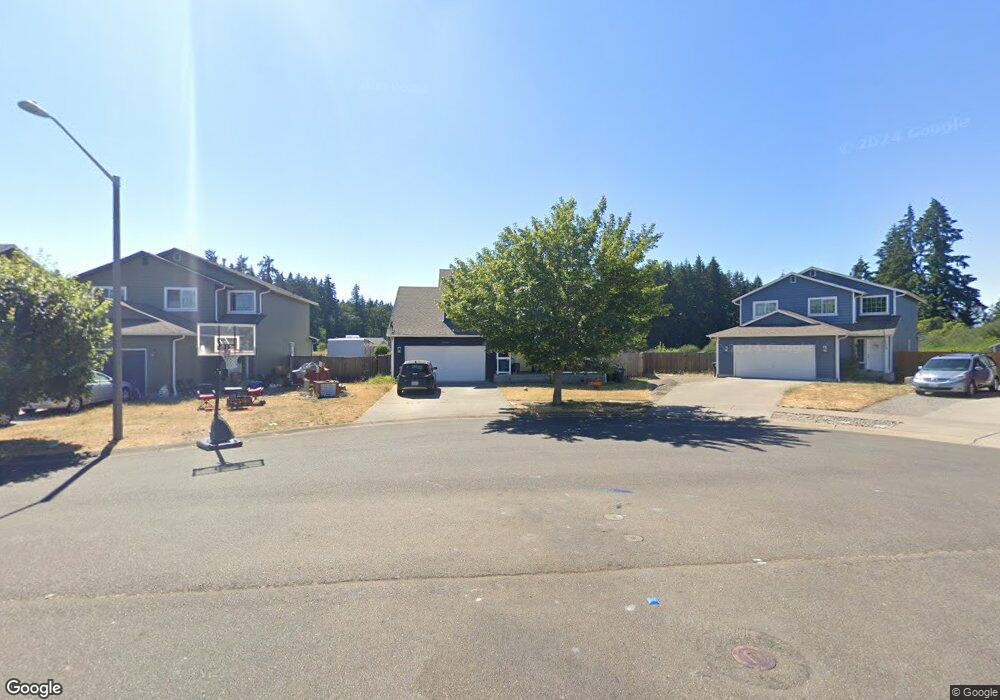
This home is located at 10673 Umtanum St SE, Yelm, WA 98597 and is currently estimated at $510,421, approximately $253 per square foot. 10673 Umtanum St SE is a home located in Thurston County with nearby schools including Mill Pond Elementary School, Ridgeline Middle School, and Yelm High School.
Ownership History
Date
Name
Owned For
Owner Type
Purchase Details
Closed on
Feb 1, 2024
Sold by
Schutter Ruth A
Bought by
Rivers Shane and Sanford Rachael
Current Estimated Value
Home Financials for this Owner
Home Financials are based on the most recent Mortgage that was taken out on this home.
Original Mortgage
$356,125
Outstanding Balance
$349,831
Interest Rate
6.61%
Mortgage Type
FHA
Estimated Equity
$160,590
Purchase Details
Closed on
Jul 24, 2018
Sold by
Beyer Charles L
Bought by
Schutter Ruth A
Home Financials for this Owner
Home Financials are based on the most recent Mortgage that was taken out on this home.
Original Mortgage
$271,600
Interest Rate
4.5%
Mortgage Type
New Conventional
Purchase Details
Closed on
Jul 26, 2006
Sold by
Landshapes Northwest Inc
Bought by
Beyer Charles L
Home Financials for this Owner
Home Financials are based on the most recent Mortgage that was taken out on this home.
Original Mortgage
$198,584
Interest Rate
6.75%
Mortgage Type
Unknown
Create a Home Valuation Report for This Property
The Home Valuation Report is an in-depth analysis detailing your home's value as well as a comparison with similar homes in the area
Home Values in the Area
Average Home Value in this Area
Purchase History
| Date | Buyer | Sale Price | Title Company |
|---|---|---|---|
| Rivers Shane | $470,000 | Chicago Title | |
| Schutter Ruth A | $279,719 | Chicago Title | |
| Beyer Charles L | $213,367 | Chicago Title Company |
Source: Public Records
Mortgage History
| Date | Status | Borrower | Loan Amount |
|---|---|---|---|
| Open | Rivers Shane | $356,125 | |
| Previous Owner | Schutter Ruth A | $271,600 | |
| Previous Owner | Beyer Charles L | $198,584 |
Source: Public Records
Tax History Compared to Growth
Tax History
| Year | Tax Paid | Tax Assessment Tax Assessment Total Assessment is a certain percentage of the fair market value that is determined by local assessors to be the total taxable value of land and additions on the property. | Land | Improvement |
|---|---|---|---|---|
| 2024 | $4,600 | $510,100 | $133,000 | $377,100 |
| 2023 | $4,600 | $471,400 | $106,000 | $365,400 |
| 2022 | $4,310 | $494,200 | $73,900 | $420,300 |
| 2021 | $4,069 | $391,600 | $78,700 | $312,900 |
| 2020 | $3,926 | $321,400 | $55,200 | $266,200 |
| 2019 | $3,052 | $302,900 | $48,800 | $254,100 |
| 2018 | $3,363 | $248,100 | $24,400 | $223,700 |
| 2017 | $2,931 | $226,650 | $24,050 | $202,600 |
| 2016 | $2,567 | $200,650 | $30,950 | $169,700 |
| 2014 | -- | $187,200 | $29,700 | $157,500 |
Source: Public Records
Map
Nearby Homes
- 15739 Yelm Terra Way SE
- 10236 West Rd SE
- 201 3rd St NE
- 10024 Cochrane Ave SE
- 10004 Greenbrier Ct SE
- 16127 Prairie Creek Loop SE
- 10412 Barry Bridges St SE
- 15418 107th Loop SE
- 15316 Carter Ct SE
- 15315 Carter Ct SE
- 15328 104th Ave SE
- 15130 Carter Loop SE
- 9745 Hay St SE
- 9738 Hay St SE
- 9756 Hay St SE
- 9744 Hay St SE
- 9703 Hay St SE
- 9721 Hay St SE
- 9727 Hay St SE
- 9733 Hay St SE
- 10701 Umtanum St SE
- 10685 Umtanum St SE
- 10691 Umtanum St SE
- 10709 Umtanum St SE
- 10702 Umtanum St SE
- 10713 Umtanum St SE
- 16129 Vancil Loop SE
- 16133 Vancil Loop SE
- 16137 Vancil Loop SE
- 16143 Vancil Loop SE
- 16125 Vancil Loop SE
- 10717 Umtanum St SE
- 16204 Birkland St SE
- 10721 Umtanum St SE
- 16121 Vancil Loop SE
- 16207 Vancil Loop SE
- 16183 Birkland St SE
- 16210 Birkland St SE
- 16189 Birkland St SE