Estimated Value: $302,000 - $357,000
--
Bed
--
Bath
2,285
Sq Ft
$146/Sq Ft
Est. Value
About This Home
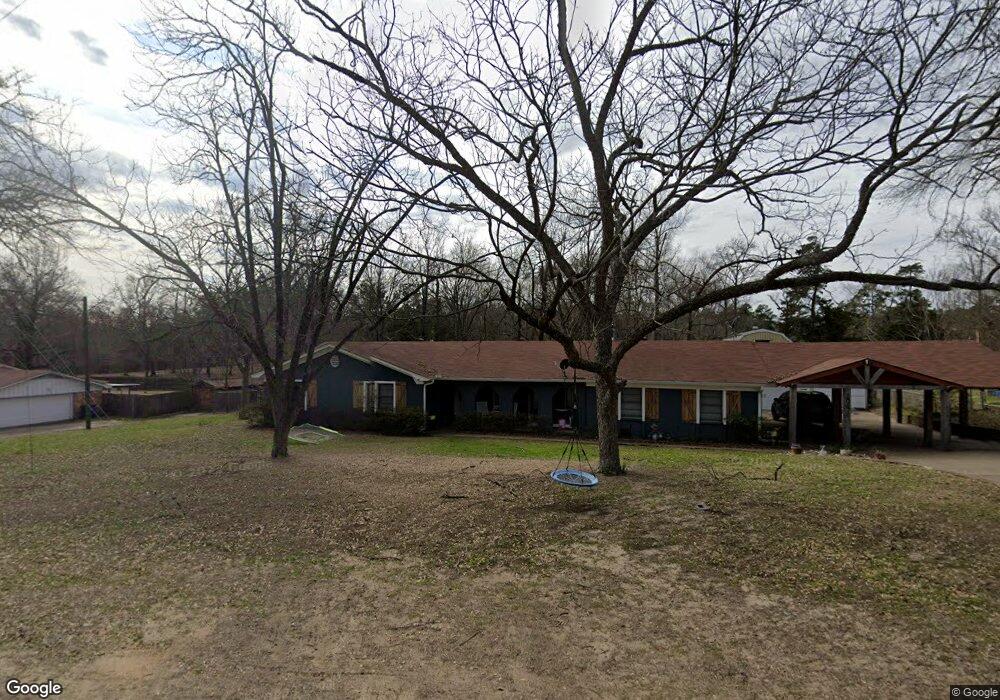
This home is located at 10676 County Road 2206, Tyler, TX 75707 and is currently estimated at $334,452, approximately $146 per square foot. 10676 County Road 2206 is a home with nearby schools including Kissam Intermediate School, Jackson Elementary School, and Chapel Hill Middle School.
Ownership History
Date
Name
Owned For
Owner Type
Purchase Details
Closed on
Jul 31, 2012
Sold by
Matheny David P and Matheny Fayette S
Bought by
Harman Rebecca
Current Estimated Value
Home Financials for this Owner
Home Financials are based on the most recent Mortgage that was taken out on this home.
Original Mortgage
$145,319
Outstanding Balance
$100,900
Interest Rate
3.87%
Mortgage Type
FHA
Estimated Equity
$233,552
Purchase Details
Closed on
Jan 20, 2011
Sold by
Fannie Mae
Bought by
Matheny David P and Matheny Fayette S
Home Financials for this Owner
Home Financials are based on the most recent Mortgage that was taken out on this home.
Original Mortgage
$94,500
Interest Rate
4.56%
Mortgage Type
New Conventional
Create a Home Valuation Report for This Property
The Home Valuation Report is an in-depth analysis detailing your home's value as well as a comparison with similar homes in the area
Home Values in the Area
Average Home Value in this Area
Purchase History
| Date | Buyer | Sale Price | Title Company |
|---|---|---|---|
| Harman Rebecca | -- | None Available | |
| Matheny David P | -- | Central Title Company | |
| Matheny David P | -- | Central Title Company |
Source: Public Records
Mortgage History
| Date | Status | Borrower | Loan Amount |
|---|---|---|---|
| Open | Harman Rebecca | $145,319 | |
| Previous Owner | Matheny David P | $94,500 |
Source: Public Records
Tax History Compared to Growth
Tax History
| Year | Tax Paid | Tax Assessment Tax Assessment Total Assessment is a certain percentage of the fair market value that is determined by local assessors to be the total taxable value of land and additions on the property. | Land | Improvement |
|---|---|---|---|---|
| 2025 | $5,049 | $295,027 | $31,724 | $263,303 |
| 2024 | $5,049 | $292,393 | $21,622 | $270,771 |
| 2023 | $4,854 | $284,210 | $21,622 | $262,588 |
| 2022 | $4,040 | $252,672 | $21,622 | $231,050 |
| 2021 | $3,328 | $195,318 | $18,018 | $177,300 |
| 2020 | $3,468 | $195,318 | $18,018 | $177,300 |
| 2019 | $3,267 | $176,398 | $18,018 | $158,380 |
| 2018 | $2,952 | $160,037 | $18,018 | $142,019 |
| 2017 | $3,035 | $163,647 | $18,018 | $145,629 |
| 2016 | $2,968 | $160,010 | $18,018 | $141,992 |
| 2015 | $2,776 | $154,010 | $18,018 | $135,992 |
| 2014 | $2,776 | $149,285 | $18,018 | $131,267 |
Source: Public Records
Map
Nearby Homes
- 10789 County Road 214
- 10680 County Road 214
- 9961 Creek Bend Dr
- 13310 White Tail Dr
- 13311 White Tail Dr
- 13311 White Tail Dr Unit 1
- 13332 White Tail Dr
- 11452 County Road 2326
- 7789 Lakeshore Dr
- 13807 County Road 220
- 13800 County Road 220
- 13594 State Highway 64 E
- 00 County Road 2209
- 10788 County Road 225
- 8217 County Road 219
- 8226 County Road 219
- 3515 Chapel View
- 3507 Chapel View
- 3515 & 3507 Chapel View
- 10908 & 10914 County Road 225
- 10688 County Road 2206
- 10656 County Road 2206
- 10677 County Road 214
- 10687 County Road 2206
- 10655 County Road 2206
- 10719 County Road 2206
- 10694 County Road 2206
- 10741 County Road 2206
- 10669 County Road 214
- 10698 County Road 2206
- 10683 County Road 214
- TBD County Road 214
- 10789 & 10803 County Road 214
- 10759 County Road 2206
- 10668 Morris Rd
- 10668 Creek Bend Dr
- 10685 County Road 214
- 10775 County Road 2206
- 10600 Creek Bend Dr
- 10836 County Road 2206