10679 Serenbe Ln Palmetto, GA 30268
Estimated Value: $1,105,000 - $1,375,000
3
Beds
2
Baths
2,881
Sq Ft
$415/Sq Ft
Est. Value
About This Home
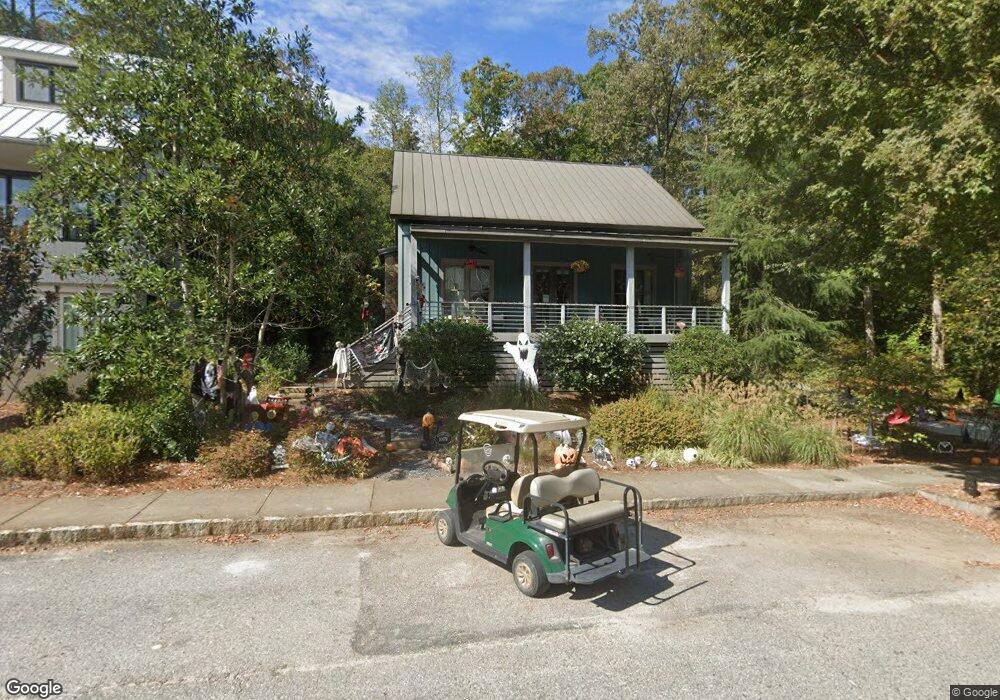
This home is located at 10679 Serenbe Ln, Palmetto, GA 30268 and is currently estimated at $1,194,193, approximately $414 per square foot. 10679 Serenbe Ln is a home with nearby schools including Palmetto Elementary School, Bear Creek Middle School, and Creekside High School.
Ownership History
Date
Name
Owned For
Owner Type
Purchase Details
Closed on
Dec 29, 2020
Sold by
Heiberger Joseph A
Bought by
Mass Jared and Mass Amy M
Current Estimated Value
Home Financials for this Owner
Home Financials are based on the most recent Mortgage that was taken out on this home.
Original Mortgage
$510,400
Outstanding Balance
$453,443
Interest Rate
2.71%
Mortgage Type
New Conventional
Estimated Equity
$740,750
Purchase Details
Closed on
Mar 14, 2013
Sold by
Heiberger Joseph A
Bought by
Heiberger Joseph Bessie Trus and Heiberger Bessie M Living Trus
Purchase Details
Closed on
Feb 24, 2012
Sold by
Serenbe Development Corp
Bought by
Heiberger Joseph A and Heiberger Bessie M
Home Financials for this Owner
Home Financials are based on the most recent Mortgage that was taken out on this home.
Original Mortgage
$255,000
Interest Rate
3.5%
Mortgage Type
New Conventional
Purchase Details
Closed on
May 5, 2009
Sold by
Capstone Serenbe Llc
Bought by
Regions Bank
Create a Home Valuation Report for This Property
The Home Valuation Report is an in-depth analysis detailing your home's value as well as a comparison with similar homes in the area
Home Values in the Area
Average Home Value in this Area
Purchase History
| Date | Buyer | Sale Price | Title Company |
|---|---|---|---|
| Mass Jared | $785,000 | -- | |
| Heiberger Joseph Bessie Trus | -- | -- | |
| Heiberger Joseph A | $140,000 | -- | |
| Regions Bank | $1,718,999 | -- |
Source: Public Records
Mortgage History
| Date | Status | Borrower | Loan Amount |
|---|---|---|---|
| Open | Mass Jared | $510,400 | |
| Closed | Mass Jared | $116,815 | |
| Previous Owner | Heiberger Joseph A | $255,000 |
Source: Public Records
Tax History Compared to Growth
Tax History
| Year | Tax Paid | Tax Assessment Tax Assessment Total Assessment is a certain percentage of the fair market value that is determined by local assessors to be the total taxable value of land and additions on the property. | Land | Improvement |
|---|---|---|---|---|
| 2025 | $15,117 | $452,800 | $125,720 | $327,080 |
| 2023 | $14,045 | $497,600 | $125,840 | $371,760 |
| 2022 | $11,583 | $362,520 | $78,520 | $284,000 |
| 2021 | $12,003 | $328,040 | $75,160 | $252,880 |
| 2020 | $9,081 | $292,960 | $74,360 | $218,600 |
| 2019 | $8,929 | $287,760 | $73,040 | $214,720 |
| 2018 | $9,658 | $281,000 | $71,320 | $209,680 |
| 2017 | $9,313 | $237,720 | $77,280 | $160,440 |
| 2016 | $9,542 | $237,720 | $77,280 | $160,440 |
| 2015 | $9,321 | $272,360 | $77,280 | $195,080 |
| 2014 | $9,892 | $237,720 | $61,760 | $175,960 |
Source: Public Records
Map
Nearby Homes
- 10671 Serenbe Ln
- 10625 Serenbe Ln Unit 204
- 721 Rausch Ridge
- 10610 Serenbe Ln
- 122 Gainey Ln
- 1171 Lupo Loop
- 1250 Lupo Loop
- 1101 Lupo Loop
- 1210 Lupo Loop
- 1188 Lupo Loop
- 1131 Lupo Loop
- 10939 Serenbe Ln
- 1160 Lupo Loop
- 10548 Serenbe Ln
- 10559 Serenbe Ln
- 10931 Serenbe Ln
- 10944 Serenbe Ln
- 1015 Loliver Ln
- 290 Tabb Way
- 10862 Serenbe Ln
- 10683 Serenbe Ln
- 10675 Serenbe Ln
- 10675 Serenbe Ln Unit 2
- 10675 Serenbe Ln
- 10676 Serenbe Ln
- 10680 Serenbe Ln
- 10671 Serenbe Ln Unit 2
- 10671 Serenbe Ln
- 10671 Serenbe Ln Unit 152
- 10668 Serenbe Ln
- 10668 Serenbe Ln Unit 210
- 10684 Serenbe Ln
- 10691 Serenbe Ln
- 10667 Serenbe Ln
- 10667 Serenbe Ln Unit N/A
- 10667 Serenbe Ln Unit 2
- 10660 Serenbe Ln
- 10663 Serenbe Ln
- 10663 Serenbe Ln Unit 2
- 10659 Serenbe Ln