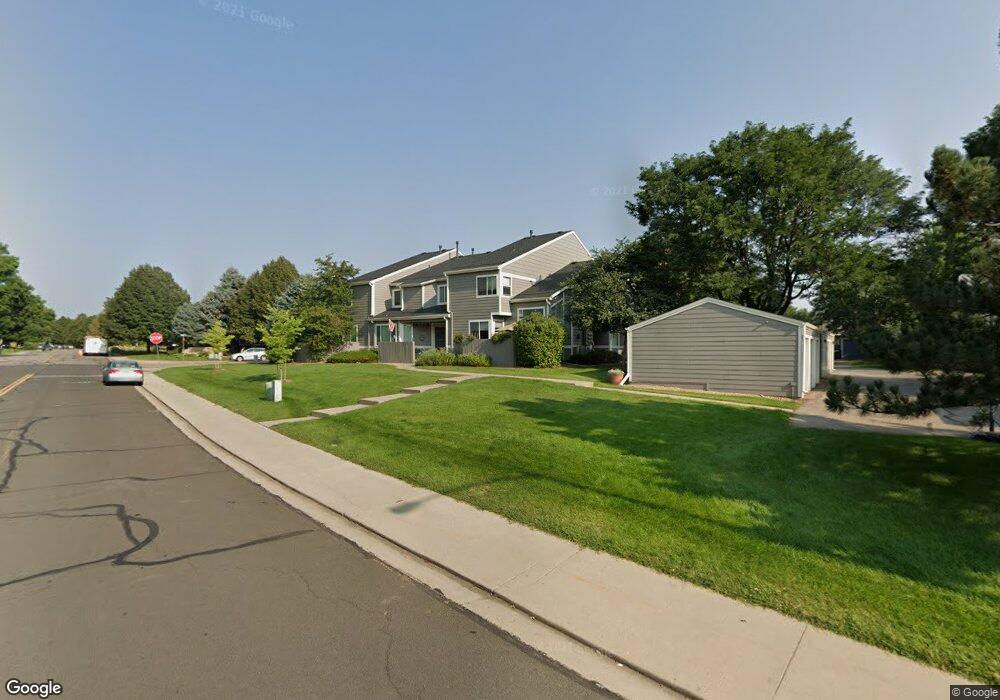
1068 Delta Dr Unit F Lafayette, CO 80026
Estimated Value: $390,000 - $438,000
2
Beds
2
Baths
992
Sq Ft
$414/Sq Ft
Est. Value
About This Home
This home is located at 1068 Delta Dr Unit F, Lafayette, CO 80026 and is currently estimated at $410,998, approximately $414 per square foot. 1068 Delta Dr Unit F is a home located in Boulder County with nearby schools including Ryan Elementary School, Angevine Middle School, and Centaurus High School.
Ownership History
Date
Name
Owned For
Owner Type
Purchase Details
Closed on
Jul 3, 2024
Sold by
End-Ira Inc and Speaker Anne Kay
Bought by
Bielanski Karla M
Current Estimated Value
Home Financials for this Owner
Home Financials are based on the most recent Mortgage that was taken out on this home.
Original Mortgage
$433,110
Outstanding Balance
$427,887
Interest Rate
6.94%
Mortgage Type
FHA
Estimated Equity
-$16,889
Purchase Details
Closed on
Aug 28, 2009
Sold by
Fuller David W
Bought by
Speaker Anne Kay and End Ira Inc
Purchase Details
Closed on
Dec 11, 2003
Sold by
Plummer Jeffrey C
Bought by
Fuller David W
Home Financials for this Owner
Home Financials are based on the most recent Mortgage that was taken out on this home.
Original Mortgage
$157,600
Interest Rate
5.25%
Mortgage Type
Purchase Money Mortgage
Create a Home Valuation Report for This Property
The Home Valuation Report is an in-depth analysis detailing your home's value as well as a comparison with similar homes in the area
Home Values in the Area
Average Home Value in this Area
Purchase History
| Date | Buyer | Sale Price | Title Company |
|---|---|---|---|
| Bielanski Karla M | $441,100 | Htc | |
| Speaker Anne Kay | $199,500 | None Available | |
| Fuller David W | $197,000 | Land Title Guarantee Company |
Source: Public Records
Mortgage History
| Date | Status | Borrower | Loan Amount |
|---|---|---|---|
| Open | Bielanski Karla M | $433,110 | |
| Previous Owner | Fuller David W | $157,600 | |
| Closed | Fuller David W | $35,460 |
Source: Public Records
Tax History Compared to Growth
Tax History
| Year | Tax Paid | Tax Assessment Tax Assessment Total Assessment is a certain percentage of the fair market value that is determined by local assessors to be the total taxable value of land and additions on the property. | Land | Improvement |
|---|---|---|---|---|
| 2025 | $2,126 | $26,713 | -- | $26,713 |
| 2024 | $2,126 | $26,713 | -- | $26,713 |
| 2023 | $2,090 | $23,997 | -- | $27,682 |
| 2022 | $2,177 | $23,171 | $0 | $23,171 |
| 2021 | $2,153 | $23,838 | $0 | $23,838 |
| 2020 | $2,075 | $22,708 | $0 | $22,708 |
| 2019 | $2,047 | $22,708 | $0 | $22,708 |
| 2018 | $1,887 | $20,671 | $0 | $20,671 |
| 2017 | $1,837 | $22,853 | $0 | $22,853 |
| 2016 | $1,454 | $15,840 | $0 | $15,840 |
| 2015 | $1,363 | $12,967 | $0 | $12,967 |
| 2014 | $1,171 | $12,967 | $0 | $12,967 |
Source: Public Records
Map
Nearby Homes
- 1065 Delta Dr Unit A
- 1053 Delta Dr Unit B
- 1418 Marigold Dr
- 1191 Milo Cir Unit A
- 1116 Elysian Field Dr Unit F
- 1198 Milo Cir Unit A
- 1117 Elysian Field Dr Unit B
- 1111 Elysian Field Dr Unit D
- 1045 Milo Cir Unit A
- 1091 Milo Cir Unit B
- 1068 Milo Cir Unit A
- 911 Homer Cir
- 998 Milo Cir Unit A
- 924 Milo Cir Unit A
- 805 Argos Cir
- 880 Orion Dr
- 925 Sparta Dr
- 1711 Cato Cir Unit 21
- 1245 Ceres Dr
- 1407 Lydia Dr Unit 61
- 1064 Delta Dr Unit I6
- 1064 Delta Dr Unit I5
- 1064 Delta Dr Unit I4
- 1064 Delta Dr Unit I3
- 1064 Delta Dr Unit I2
- 1064 Delta Dr Unit I1
- 1068 Delta Dr Unit E
- 1068 Delta Dr Unit D
- 1068 Delta Dr Unit C
- 1068 Delta Dr Unit B
- 1068 Delta Dr Unit A
- 1062 Delta Dr Unit F
- 1062 Delta Dr Unit E
- 1062 Delta Dr Unit D
- 1062 Delta Dr Unit C
- 1062 Delta Dr Unit B
- 1062 Delta Dr Unit A
- 1060 Delta Dr Unit F
- 1060 Delta Dr Unit E
- 1060 Delta Dr Unit D