Estimated Value: $604,000 - $683,000
4
Beds
3
Baths
2,464
Sq Ft
$258/Sq Ft
Est. Value
About This Home
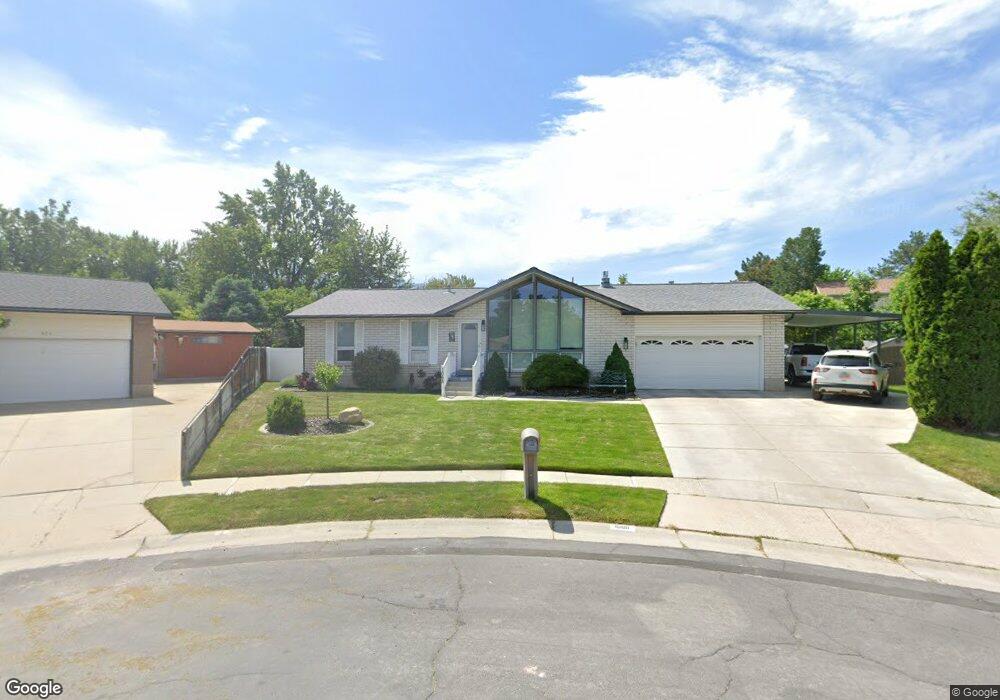
This home is located at 1068 Fallbrook Way, Sandy, UT 84094 and is currently estimated at $635,902, approximately $258 per square foot. 1068 Fallbrook Way is a home located in Salt Lake County with nearby schools including East Sandy School, Union Middle School, and Hillcrest High School.
Ownership History
Date
Name
Owned For
Owner Type
Purchase Details
Closed on
May 1, 2013
Sold by
Novak William and Novak Kayla C
Bought by
Novak William and Novak Kayla
Current Estimated Value
Home Financials for this Owner
Home Financials are based on the most recent Mortgage that was taken out on this home.
Original Mortgage
$247,000
Outstanding Balance
$172,255
Interest Rate
3.51%
Mortgage Type
New Conventional
Estimated Equity
$463,647
Purchase Details
Closed on
Nov 1, 2007
Sold by
Day Lamar E and Day Janice
Bought by
Novak William and Novak Kayla C
Home Financials for this Owner
Home Financials are based on the most recent Mortgage that was taken out on this home.
Original Mortgage
$258,500
Interest Rate
6.29%
Mortgage Type
Purchase Money Mortgage
Purchase Details
Closed on
Jan 7, 2002
Sold by
Archibald Jerry W and Archibald Karen A
Bought by
Day Lamar E and Day Janice
Home Financials for this Owner
Home Financials are based on the most recent Mortgage that was taken out on this home.
Original Mortgage
$58,000
Interest Rate
7.01%
Create a Home Valuation Report for This Property
The Home Valuation Report is an in-depth analysis detailing your home's value as well as a comparison with similar homes in the area
Home Values in the Area
Average Home Value in this Area
Purchase History
| Date | Buyer | Sale Price | Title Company |
|---|---|---|---|
| Novak William | -- | Hinghland Title Ag | |
| Novak William | -- | Priority Title Insurance Agc | |
| Day Lamar E | -- | Associated Title |
Source: Public Records
Mortgage History
| Date | Status | Borrower | Loan Amount |
|---|---|---|---|
| Open | Novak William | $247,000 | |
| Closed | Novak William | $258,500 | |
| Previous Owner | Day Lamar E | $58,000 |
Source: Public Records
Tax History
| Year | Tax Paid | Tax Assessment Tax Assessment Total Assessment is a certain percentage of the fair market value that is determined by local assessors to be the total taxable value of land and additions on the property. | Land | Improvement |
|---|---|---|---|---|
| 2025 | $3,280 | $603,700 | $167,400 | $436,300 |
| 2024 | $3,280 | $605,900 | $161,000 | $444,900 |
| 2023 | $3,280 | $595,700 | $153,000 | $442,700 |
| 2022 | $2,984 | $537,600 | $150,000 | $387,600 |
| 2021 | $2,500 | $382,600 | $116,600 | $266,000 |
| 2020 | $2,424 | $350,000 | $116,600 | $233,400 |
| 2019 | $2,352 | $330,800 | $110,000 | $220,800 |
| 2018 | $2,183 | $320,200 | $110,000 | $210,200 |
| 2017 | $2,045 | $286,300 | $110,000 | $176,300 |
| 2016 | $2,025 | $274,000 | $110,000 | $164,000 |
| 2015 | $2,121 | $266,200 | $132,400 | $133,800 |
| 2014 | $1,955 | $240,900 | $121,300 | $119,600 |
Source: Public Records
Map
Nearby Homes
- 1089 E 8320 S Unit 22
- 8373 S 1100 E Unit 39
- 8223 S 1000 E
- 8109 S Cottonwood Hills Cir
- 8268 S 865 E
- 8569 Round Stone Cove
- 8569 Round Stone Cove Unit 8
- 8450 S 865 E
- 7975 S Showcase Ln
- 8620 S 1185 E
- 8629 Vaquero Dr
- 7910 S Pear Tree Cir
- 8546 S 1330 E
- 882 E 7905 S
- 744 E 8425 S
- 760 E 8080 S
- 1448 E Estrellita Dr
- 8360 El Manicero Way
- 1371 E 8600 S
- 917 E 7865 S
- 1068 E Fallbrook Way
- 1074 Fallbrook Way
- 1073 E 8320 S
- 1073 E 8320 S Unit 16
- 1071 E 8320 S Unit 15
- 1064 Fallbrook Way
- 1075 E 8320 S Unit 17
- 1065 E 8320 S
- 1079 E 8320 S
- 1079 E 8320 S Unit 19
- 1063 E 8320 S
- 1063 E 8320 S Unit 13
- 1086 E Fallbrook Way
- 1086 Fallbrook Way
- 1081 E 8320 S
- 1081 E 8320 S Unit 20
- 1061 E 8320 S
- 1061 E 8320 S Unit 12
- 1090 Fallbrook Way
- 1090 E Fallbrook Way
Your Personal Tour Guide
Ask me questions while you tour the home.