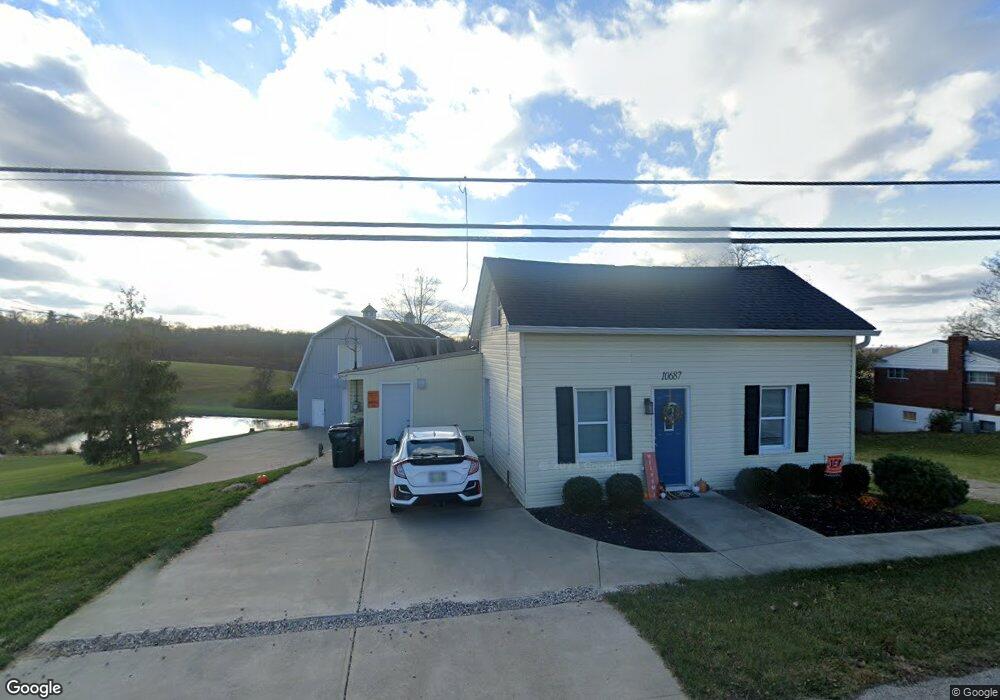
10687 Colerain Ave Cincinnati, OH 45252
Estimated Value: $225,000 - $278,000
4
Beds
1
Bath
1,820
Sq Ft
$136/Sq Ft
Est. Value
About This Home
This home is located at 10687 Colerain Ave, Cincinnati, OH 45252 and is currently estimated at $246,973, approximately $135 per square foot. 10687 Colerain Ave is a home located in Hamilton County with nearby schools including Colerain Elementary School, Colerain Middle School, and Colerain High School.
Ownership History
Date
Name
Owned For
Owner Type
Purchase Details
Closed on
Oct 18, 2019
Sold by
Steinman Shane M
Bought by
1St Home Properties
Current Estimated Value
Purchase Details
Closed on
Sep 19, 2016
Sold by
Gbw Assets Llc
Bought by
Shane M Steinmann and Alyssa N Steinmann
Home Financials for this Owner
Home Financials are based on the most recent Mortgage that was taken out on this home.
Interest Rate
3.5%
Purchase Details
Closed on
Sep 7, 2016
Sold by
Gbw Assets Llc
Bought by
Steinmann Shane M and Steinmann Alyssa N
Home Financials for this Owner
Home Financials are based on the most recent Mortgage that was taken out on this home.
Interest Rate
3.5%
Purchase Details
Closed on
Oct 20, 2014
Sold by
Schmidt Elaine H and Schmidt Timothy
Bought by
Gbw Assets Llc
Purchase Details
Closed on
Dec 9, 2002
Sold by
Bailey Romilda E and Heuer Romilda E
Bought by
Schmidt Elaine H
Create a Home Valuation Report for This Property
The Home Valuation Report is an in-depth analysis detailing your home's value as well as a comparison with similar homes in the area
Home Values in the Area
Average Home Value in this Area
Purchase History
| Date | Buyer | Sale Price | Title Company |
|---|---|---|---|
| 1St Home Properties | $68,500 | Sojourners Title Agency | |
| Shane M Steinmann | $119,250 | -- | |
| Steinmann Shane M | $119,300 | -- | |
| Gbw Assets Llc | $12,000 | Attorney | |
| Schmidt Elaine H | -- | -- |
Source: Public Records
Mortgage History
| Date | Status | Borrower | Loan Amount |
|---|---|---|---|
| Previous Owner | Shane M Steinmann | -- | |
| Previous Owner | Steinmann Shane M | $117,089 |
Source: Public Records
Tax History Compared to Growth
Tax History
| Year | Tax Paid | Tax Assessment Tax Assessment Total Assessment is a certain percentage of the fair market value that is determined by local assessors to be the total taxable value of land and additions on the property. | Land | Improvement |
|---|---|---|---|---|
| 2024 | $2,651 | $49,204 | $13,346 | $35,858 |
| 2023 | $2,664 | $49,204 | $13,346 | $35,858 |
| 2022 | $2,901 | $43,761 | $13,475 | $30,286 |
| 2021 | $2,880 | $43,761 | $13,475 | $30,286 |
| 2020 | $2,905 | $43,761 | $13,475 | $30,286 |
| 2019 | $2,936 | $41,283 | $12,712 | $28,571 |
| 2018 | $2,635 | $41,283 | $12,712 | $28,571 |
| 2017 | $2,500 | $41,283 | $12,712 | $28,571 |
| 2016 | $1,412 | $21,606 | $12,621 | $8,985 |
| 2015 | $1,406 | $21,606 | $12,621 | $8,985 |
| 2014 | $1,349 | $21,606 | $12,621 | $8,985 |
| 2013 | $1,311 | $22,047 | $12,880 | $9,167 |
Source: Public Records
Map
Nearby Homes
- 10660 Colerain Ave
- 26 Rylan Dr
- 10263 Colerain Ave
- 11115 Colerain Ave
- 5567 Day Rd
- 10054 Prechtel Rd
- 4198 Intrepid Dr
- 3834 Enterprise Cir
- 9995 Weatherly Ct
- 5285 Yeatman Rd
- 4352 Courageous Cir Unit 59
- 9940 Regatta Dr
- 10354 Fay Ln
- 4302 Courageous Cir Unit 83
- 9940 Prechtel Rd
- 4280 Defender Dr
- 9905 Regatta Dr
- Pearson Plan at Villas at Taylor Glen
- 9901 Regatta Dr
- 5077 Pebblevalley Dr
- 10687 Old Colerain Ave
- 10659 Colerain Rd
- 10659 Colerain Rd
- 10697 Colerain Ave
- 10670 Colerain Rd
- 10716 Colerain Ave
- 10626 Colerain Ave
- 10653 Colerain Ave
- 10741 Colerain Ave
- 10625 Colerain Ave
- 10751 Colerain Rd
- 10662 Colerain Rd
- 10626 Old Colerain Ave
- 10776 Colerain Ave
- 10587 Colerain Ave
- 10789 Colerain Rd
- 10569 Colerain Rd
- 10630 Colerain Ave
- 10826 Colerain Ave
- 10811 Colerain Ave