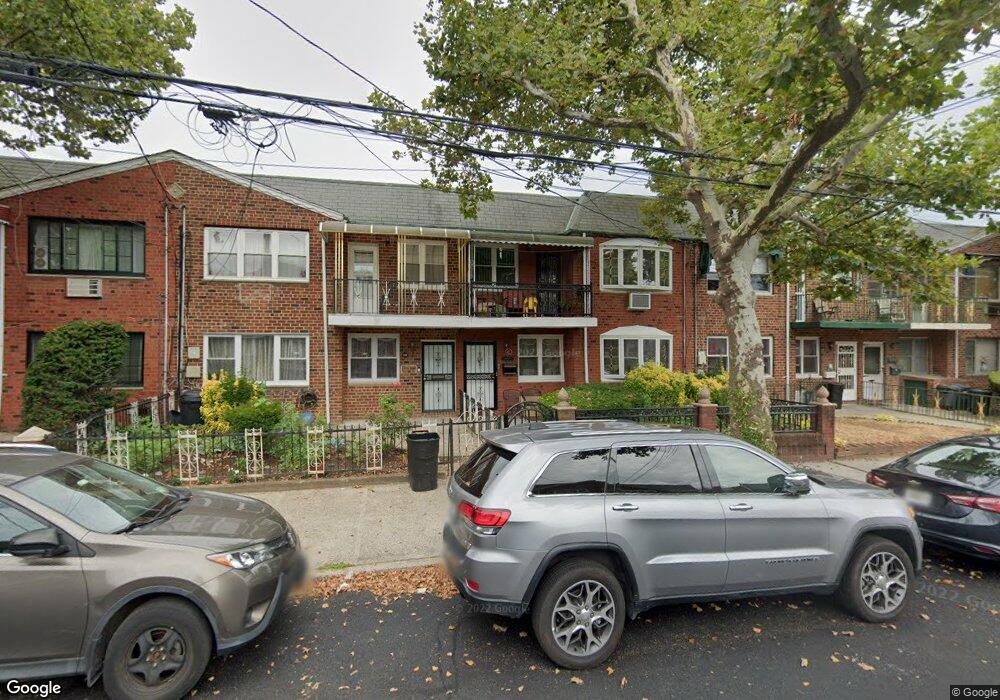
1069 E 57th St Brooklyn, NY 11234
Flatlands NeighborhoodEstimated Value: $808,979 - $1,088,000
Studio
--
Bath
2,472
Sq Ft
$384/Sq Ft
Est. Value
About This Home
This home is located at 1069 E 57th St, Brooklyn, NY 11234 and is currently estimated at $950,245, approximately $384 per square foot. 1069 E 57th St is a home located in Kings County with nearby schools including P.S. 203 Floyd Bennett, Success Academy Charter School - Bergen Beach, and Yeshivah of Crown Heights.
Ownership History
Date
Name
Owned For
Owner Type
Purchase Details
Closed on
Apr 8, 2004
Sold by
Lobban Patricia and Welch Audrey
Bought by
Welch Audrey
Current Estimated Value
Purchase Details
Closed on
Sep 27, 2000
Sold by
Downer Wesley Sylvanus
Bought by
Welch Audrey and Lobban Patricia
Home Financials for this Owner
Home Financials are based on the most recent Mortgage that was taken out on this home.
Original Mortgage
$294,500
Outstanding Balance
$103,841
Interest Rate
7.83%
Estimated Equity
$846,404
Purchase Details
Closed on
Jul 25, 1996
Sold by
Klein Arlene
Bought by
Downer Wesley Sylvanus and Levine Ivianne A
Home Financials for this Owner
Home Financials are based on the most recent Mortgage that was taken out on this home.
Original Mortgage
$190,800
Interest Rate
8.24%
Create a Home Valuation Report for This Property
The Home Valuation Report is an in-depth analysis detailing your home's value as well as a comparison with similar homes in the area
Home Values in the Area
Average Home Value in this Area
Purchase History
| Date | Buyer | Sale Price | Title Company |
|---|---|---|---|
| Welch Audrey | -- | -- | |
| Welch Audrey | -- | -- | |
| Welch Audrey | $310,000 | Commonwealth Land Title Ins | |
| Welch Audrey | $310,000 | Commonwealth Land Title Ins | |
| Downer Wesley Sylvanus | $238,500 | Commonwealth Land Title Ins | |
| Downer Wesley Sylvanus | $238,500 | Commonwealth Land Title Ins |
Source: Public Records
Mortgage History
| Date | Status | Borrower | Loan Amount |
|---|---|---|---|
| Open | Welch Audrey | $294,500 | |
| Closed | Welch Audrey | $294,500 | |
| Previous Owner | Downer Wesley Sylvanus | $190,800 | |
| Closed | Welch Audrey | $0 |
Source: Public Records
Tax History
| Year | Tax Paid | Tax Assessment Tax Assessment Total Assessment is a certain percentage of the fair market value that is determined by local assessors to be the total taxable value of land and additions on the property. | Land | Improvement |
|---|---|---|---|---|
| 2025 | $7,268 | $50,400 | $9,180 | $41,220 |
| 2024 | $7,268 | $57,720 | $9,180 | $48,540 |
| 2023 | $7,291 | $55,680 | $9,180 | $46,500 |
| 2022 | $6,738 | $44,460 | $9,180 | $35,280 |
| 2021 | $6,691 | $48,780 | $9,180 | $39,600 |
| 2020 | $3,129 | $36,780 | $9,180 | $27,600 |
| 2019 | $6,259 | $36,780 | $9,180 | $27,600 |
| 2018 | $6,039 | $31,084 | $6,282 | $24,802 |
| 2017 | $5,678 | $29,325 | $8,012 | $21,313 |
| 2016 | $5,221 | $27,666 | $7,668 | $19,998 |
| 2015 | $3,999 | $26,100 | $10,200 | $15,900 |
| 2014 | $3,999 | $26,100 | $10,200 | $15,900 |
Source: Public Records
Map
Nearby Homes
- 1037 E 57th St
- 1106 E 58th St
- 1070 E 59th St
- 1186 E 56th St
- 5515 Avenue K
- 1122 E 57th St
- 1239 E 55th St
- 1206 E 58th St
- 2042 Ralph Ave
- 1181 E 55th St
- 1258 E 56th St
- 1296 E 54th St
- 1072 E 73rd St Unit 93
- 1072 E 73rd St Unit 3C
- 1091 E 72nd St Unit 20
- 1070 E 73rd St Unit G50
- 1093 E 72nd St Unit 13
- 1095 E 72nd St Unit 10
- 1078 E 73rd St Unit 84
- 1084 E 73rd St Unit 4A
- 1073 E 57th St
- 1067 E 57th St
- 1075 E 57th St
- 1065 E 57th St
- 1079 E 57th St
- 1061 E 57th St
- 1136 E 58th St
- 1140 E 58th St
- 1144 E 58th St
- 1144 E 58th St Unit 2
- 1134 E 58th St
- 1081 E 57th St
- 1142 E 58th St
- 1057 E 57th St
- 1130 E 58th St
- 1128 E 58th St
- 1146 E 58th St
- 1146 E 58th St Unit 1
- 1146 E 58th St Unit 3
- 1146 E 58th St Unit 2
Your Personal Tour Guide
Ask me questions while you tour the home.