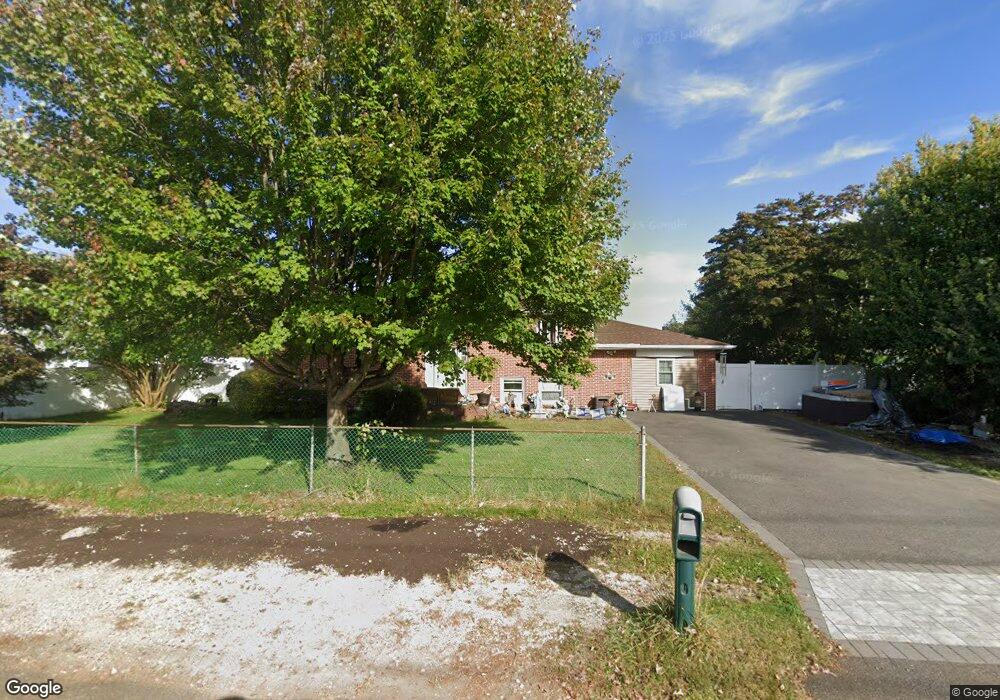
1069 Ferndale Blvd Central Islip, NY 11722
Estimated Value: $685,000 - $744,000
7
Beds
3
Baths
2,805
Sq Ft
$255/Sq Ft
Est. Value
About This Home
This home is located at 1069 Ferndale Blvd, Central Islip, NY 11722 and is currently estimated at $714,205, approximately $254 per square foot. 1069 Ferndale Blvd is a home located in Suffolk County with nearby schools including Anthony Alfano Elementary School and Central Islip Senior High School.
Ownership History
Date
Name
Owned For
Owner Type
Purchase Details
Closed on
Aug 11, 2021
Sold by
Mateo Marcelino
Bought by
Diaz Jose and Guerrero Franklin
Current Estimated Value
Home Financials for this Owner
Home Financials are based on the most recent Mortgage that was taken out on this home.
Original Mortgage
$475,000
Interest Rate
2.8%
Mortgage Type
Stand Alone Refi Refinance Of Original Loan
Purchase Details
Closed on
Mar 3, 2000
Sold by
American Dream Homes Inc
Bought by
Mateo Marcelino
Home Financials for this Owner
Home Financials are based on the most recent Mortgage that was taken out on this home.
Original Mortgage
$175,750
Interest Rate
7.92%
Create a Home Valuation Report for This Property
The Home Valuation Report is an in-depth analysis detailing your home's value as well as a comparison with similar homes in the area
Home Values in the Area
Average Home Value in this Area
Purchase History
| Date | Buyer | Sale Price | Title Company |
|---|---|---|---|
| Diaz Jose | -- | None Available | |
| Diaz Jose | -- | None Available | |
| Mateo Marcelino | $185,000 | -- | |
| American Dream Homes Inc | -- | -- | |
| American Dream Homes Inc | -- | -- |
Source: Public Records
Mortgage History
| Date | Status | Borrower | Loan Amount |
|---|---|---|---|
| Previous Owner | Diaz Jose | $475,000 | |
| Previous Owner | American Dream Homes Inc | $175,750 |
Source: Public Records
Tax History
| Year | Tax Paid | Tax Assessment Tax Assessment Total Assessment is a certain percentage of the fair market value that is determined by local assessors to be the total taxable value of land and additions on the property. | Land | Improvement |
|---|---|---|---|---|
| 2024 | $12,446 | $39,500 | $7,400 | $32,100 |
| 2023 | $12,446 | $39,500 | $7,400 | $32,100 |
| 2022 | $11,679 | $39,500 | $7,400 | $32,100 |
| 2021 | $11,679 | $39,500 | $7,400 | $32,100 |
| 2020 | $12,114 | $39,500 | $7,400 | $32,100 |
| 2019 | $12,114 | $0 | $0 | $0 |
| 2018 | -- | $39,500 | $7,400 | $32,100 |
| 2017 | $11,844 | $39,500 | $7,400 | $32,100 |
| 2016 | $11,753 | $39,500 | $7,400 | $32,100 |
| 2015 | -- | $39,500 | $7,400 | $32,100 |
| 2014 | -- | $39,500 | $7,400 | $32,100 |
Source: Public Records
Map
Nearby Homes
Your Personal Tour Guide
Ask me questions while you tour the home.