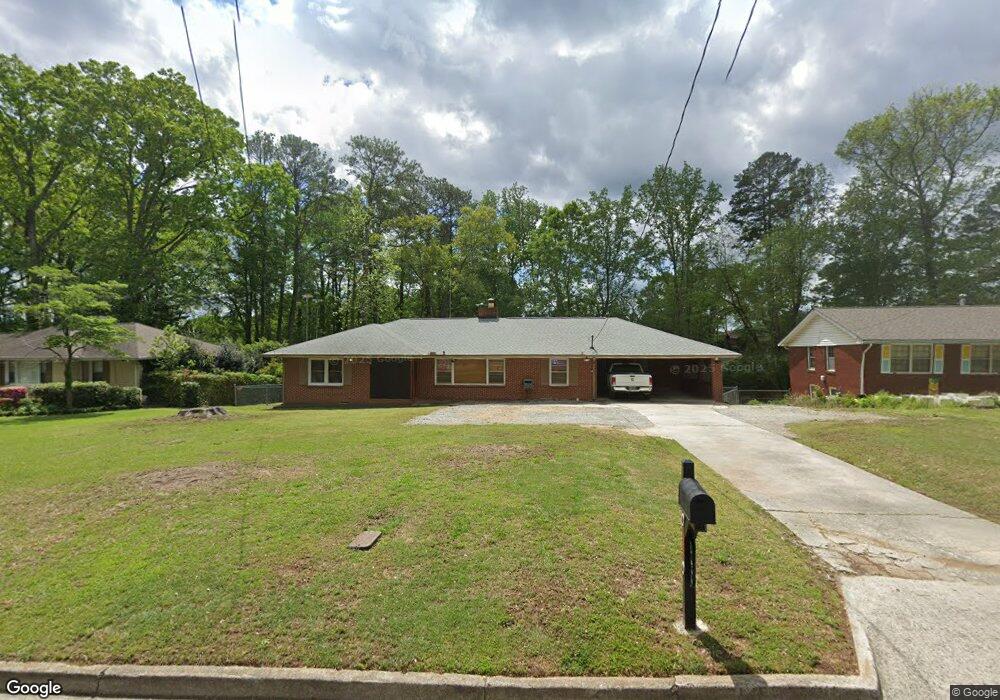
1069 Helen St Morrow, GA 30260
Estimated Value: $219,357 - $290,000
3
Beds
2
Baths
1,946
Sq Ft
$132/Sq Ft
Est. Value
About This Home
This home is located at 1069 Helen St, Morrow, GA 30260 and is currently estimated at $256,589, approximately $131 per square foot. 1069 Helen St is a home located in Clayton County with nearby schools including Lake City Elementary School, Babb Middle School, and Forest Park High School.
Ownership History
Date
Name
Owned For
Owner Type
Purchase Details
Closed on
Mar 27, 2017
Sold by
Makara Mao
Bought by
Kirkland Guthri Gwendolyn E and Guthridge Franklin
Current Estimated Value
Home Financials for this Owner
Home Financials are based on the most recent Mortgage that was taken out on this home.
Original Mortgage
$126,663
Outstanding Balance
$104,262
Interest Rate
4.25%
Mortgage Type
FHA
Estimated Equity
$152,327
Purchase Details
Closed on
Nov 3, 2016
Bought by
Mao Makara
Purchase Details
Closed on
Apr 5, 2016
Sold by
Pennymac Loan Svcs Llc
Bought by
Secretary Of Veterans Affairs
Purchase Details
Closed on
Feb 8, 2008
Sold by
Smith Carrie L
Bought by
Price Hal
Home Financials for this Owner
Home Financials are based on the most recent Mortgage that was taken out on this home.
Original Mortgage
$115,000
Interest Rate
6%
Mortgage Type
VA
Create a Home Valuation Report for This Property
The Home Valuation Report is an in-depth analysis detailing your home's value as well as a comparison with similar homes in the area
Home Values in the Area
Average Home Value in this Area
Purchase History
| Date | Buyer | Sale Price | Title Company |
|---|---|---|---|
| Kirkland Guthri Gwendolyn E | $129,000 | -- | |
| Mao Makara | $67,000 | -- | |
| Secretary Of Veterans Affairs | $74,844 | -- | |
| Pennymac Loan Svcs Llc | $74,844 | -- | |
| Price Hal | $115,000 | -- |
Source: Public Records
Mortgage History
| Date | Status | Borrower | Loan Amount |
|---|---|---|---|
| Open | Kirkland Guthri Gwendolyn E | $126,663 | |
| Previous Owner | Price Hal | $115,000 |
Source: Public Records
Tax History
| Year | Tax Paid | Tax Assessment Tax Assessment Total Assessment is a certain percentage of the fair market value that is determined by local assessors to be the total taxable value of land and additions on the property. | Land | Improvement |
|---|---|---|---|---|
| 2025 | $2,935 | $76,640 | $4,400 | $72,240 |
| 2024 | $2,096 | $63,720 | $4,400 | $59,320 |
| 2023 | $2,228 | $61,720 | $4,400 | $57,320 |
| 2022 | $1,488 | $47,920 | $4,400 | $43,520 |
| 2021 | $1,401 | $45,480 | $4,400 | $41,080 |
| 2020 | $1,363 | $44,077 | $10,000 | $34,077 |
| 2019 | $1,355 | $43,374 | $10,000 | $33,374 |
| 2018 | $1,450 | $45,707 | $10,000 | $35,707 |
| 2017 | $1,091 | $26,800 | $10,000 | $16,800 |
| 2016 | $0 | $30,205 | $10,000 | $20,205 |
| 2015 | -- | $0 | $0 | $0 |
| 2014 | -- | $32,062 | $10,000 | $22,062 |
Source: Public Records
Map
Nearby Homes
- 1077 Helen St
- 98 Werner Brook Way SW
- 5179 Laurel Cir
- 5163 East St
- 880 White Oak Dr
- 5489 Ahyoka Dr
- 5316 Ash St
- 1241 Tsali Trail
- 780 South Ave
- 5344 Sharon St
- 5278 Madison St
- 5355 Sharon St
- 0 Ash St Unit 10563129
- 5058 Park Ave
- 5535 Cypress Dr
- 5074 Park Ave
- 4881 Price St
- 1058 Phillips Cir
- 5310 Lyndale Cir
- 4971 Lake Dr
- 1057 Helen St
- 1087 Helen St
- 1047 Helen St
- 1070 Helen St
- 1078 Helen St
- 1054 Helen St
- 1048 Helen St
- 1042 Helen St Unit 1042
- 5219 Woodland Dr
- 5206 Warner St
- 5194 Warner St
- 1100 Helen St
- 5241 Woodland Dr
- 5188 Warner St
- 5283 Woodland Dr
- 5287 Woodland Dr
- 5279 Woodland Dr
- 5291 Woodland Dr
- 5275 Woodland Dr
- 1057 Woodland Way
Your Personal Tour Guide
Ask me questions while you tour the home.