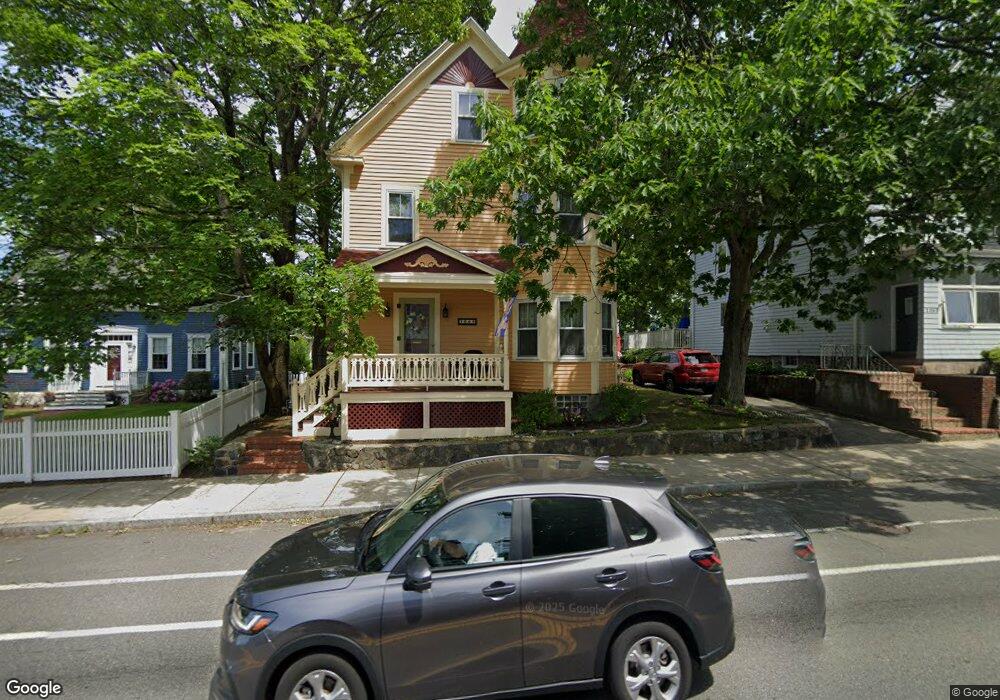
1069 Main St Melrose, MA 02176
Horace Mann NeighborhoodEstimated Value: $818,526 - $992,000
4
Beds
2
Baths
2,777
Sq Ft
$323/Sq Ft
Est. Value
About This Home
This home is located at 1069 Main St, Melrose, MA 02176 and is currently estimated at $897,132, approximately $323 per square foot. 1069 Main St is a home located in Middlesex County with nearby schools including Horace Mann Elementary School, Roosevelt Elementary School, and Winthrop Elementary School.
Ownership History
Date
Name
Owned For
Owner Type
Purchase Details
Closed on
May 5, 1988
Sold by
Fanaldi Robert F
Bought by
Sirois Andre J
Current Estimated Value
Home Financials for this Owner
Home Financials are based on the most recent Mortgage that was taken out on this home.
Original Mortgage
$135,000
Interest Rate
9.94%
Mortgage Type
Purchase Money Mortgage
Create a Home Valuation Report for This Property
The Home Valuation Report is an in-depth analysis detailing your home's value as well as a comparison with similar homes in the area
Home Values in the Area
Average Home Value in this Area
Purchase History
| Date | Buyer | Sale Price | Title Company |
|---|---|---|---|
| Sirois Andre J | $150,000 | -- |
Source: Public Records
Mortgage History
| Date | Status | Borrower | Loan Amount |
|---|---|---|---|
| Closed | Sirois Andre J | $132,000 | |
| Closed | Sirois Andre J | $135,000 |
Source: Public Records
Tax History
| Year | Tax Paid | Tax Assessment Tax Assessment Total Assessment is a certain percentage of the fair market value that is determined by local assessors to be the total taxable value of land and additions on the property. | Land | Improvement |
|---|---|---|---|---|
| 2025 | $65 | $658,400 | $335,900 | $322,500 |
| 2024 | $6,248 | $629,200 | $314,200 | $315,000 |
| 2023 | $5,807 | $557,300 | $292,600 | $264,700 |
| 2022 | $5,723 | $541,400 | $281,700 | $259,700 |
| 2021 | $5,662 | $517,100 | $270,900 | $246,200 |
| 2020 | $5,474 | $495,400 | $249,200 | $246,200 |
| 2019 | $5,058 | $467,900 | $238,400 | $229,500 |
| 2018 | $4,841 | $427,300 | $197,800 | $229,500 |
| 2017 | $4,649 | $394,000 | $189,600 | $204,400 |
| 2016 | $4,488 | $364,000 | $168,000 | $196,000 |
| 2015 | $4,414 | $340,600 | $168,000 | $172,600 |
| 2014 | $4,343 | $327,000 | $154,400 | $172,600 |
Source: Public Records
Map
Nearby Homes
- 89 Lovell Rd
- 98 Boardman Ave
- 58 Franklin St Unit 58
- 60 Franklin St Unit 60
- 23 Ellsworth Ave
- 7 West St
- 51 Melrose St Unit 1C
- 51 Melrose St Unit 1A
- 24 Ellsworth Ave
- 128 Green St Unit 128
- 9 Ledge St
- 176 Bay State Rd
- 601 Franklin St Unit 2
- 109 Linden Rd
- 8 Crystal St Unit 2
- 8 Crystal St Unit 3
- 132 Walton Park
- 35 Maple Rd
- 11 Ludlow Ave
- 9 Elmcrest Cir
Your Personal Tour Guide
Ask me questions while you tour the home.