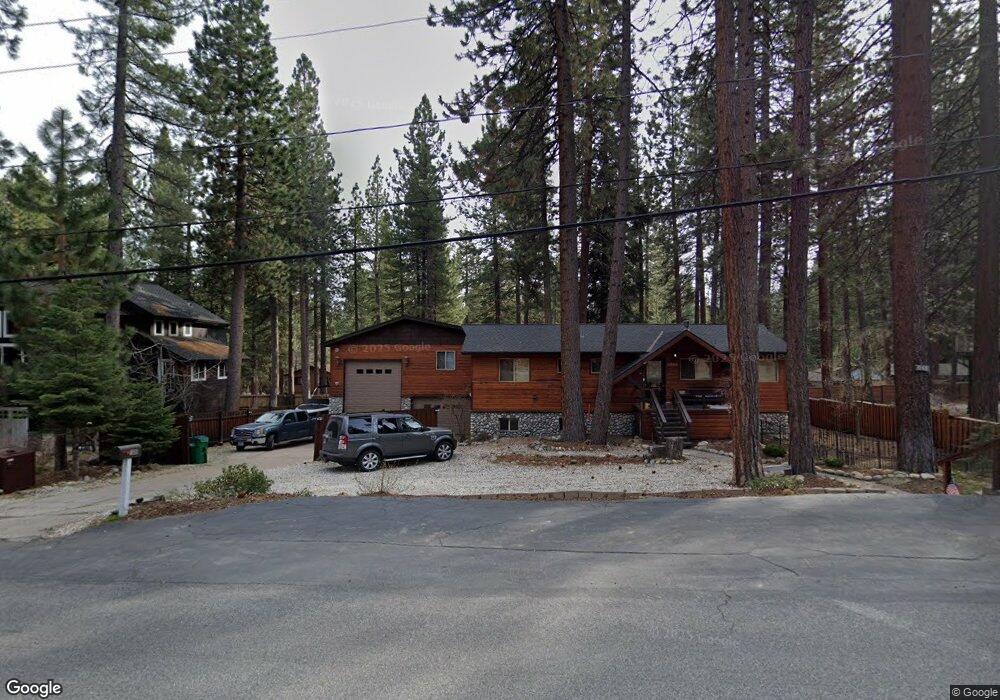
1069 Mill Creek Rd Incline Village, NV 89451
Estimated Value: $2,008,000 - $2,843,000
3
Beds
3
Baths
2,204
Sq Ft
$1,102/Sq Ft
Est. Value
About This Home
This home is located at 1069 Mill Creek Rd, Incline Village, NV 89451 and is currently estimated at $2,428,083, approximately $1,101 per square foot. 1069 Mill Creek Rd is a home located in Washoe County with nearby schools including Incline Elementary School, Incline Middle School, and Incline High School.
Ownership History
Date
Name
Owned For
Owner Type
Purchase Details
Closed on
Jun 19, 2019
Sold by
Pizer Ronald John
Bought by
Pizer Ronald J and Ronald J Pizer Family Trust
Current Estimated Value
Purchase Details
Closed on
Apr 26, 2010
Sold by
Perhacs John D and Perhacs Michele A
Bought by
Pizer Ronald John
Purchase Details
Closed on
May 12, 1998
Sold by
Vanderhoof Richard S
Bought by
Perhacs John D and Perhacs Michele A
Home Financials for this Owner
Home Financials are based on the most recent Mortgage that was taken out on this home.
Original Mortgage
$227,000
Interest Rate
7.1%
Purchase Details
Closed on
Jul 11, 1994
Sold by
Preston Maxine E
Bought by
Vanderhoof Richard S and Richard S Vanderhoof Trust
Create a Home Valuation Report for This Property
The Home Valuation Report is an in-depth analysis detailing your home's value as well as a comparison with similar homes in the area
Home Values in the Area
Average Home Value in this Area
Purchase History
| Date | Buyer | Sale Price | Title Company |
|---|---|---|---|
| Pizer Ronald J | -- | None Available | |
| Pizer Ronald John | $636,000 | First American Title Iv | |
| Perhacs John D | $289,500 | Stewart Title | |
| Vanderhoof Richard S | $289,000 | Western Title Company Inc |
Source: Public Records
Mortgage History
| Date | Status | Borrower | Loan Amount |
|---|---|---|---|
| Previous Owner | Perhacs John D | $227,000 |
Source: Public Records
Tax History Compared to Growth
Tax History
| Year | Tax Paid | Tax Assessment Tax Assessment Total Assessment is a certain percentage of the fair market value that is determined by local assessors to be the total taxable value of land and additions on the property. | Land | Improvement |
|---|---|---|---|---|
| 2025 | $6,997 | $367,400 | $297,500 | $69,900 |
| 2024 | $6,997 | $349,565 | $280,000 | $69,565 |
| 2023 | $6,812 | $327,486 | $262,500 | $64,986 |
| 2022 | $6,952 | $282,161 | $227,500 | $54,661 |
| 2021 | $6,772 | $262,951 | $210,000 | $52,951 |
| 2020 | $6,646 | $253,206 | $201,250 | $51,956 |
| 2019 | $6,476 | $252,360 | $201,250 | $51,110 |
| 2018 | $6,312 | $241,014 | $192,500 | $48,514 |
| 2017 | $6,017 | $222,425 | $175,000 | $47,425 |
| 2016 | $6,017 | $203,097 | $157,500 | $45,597 |
| 2015 | $1,502 | $200,647 | $157,500 | $43,147 |
| 2014 | $5,856 | $200,434 | $157,500 | $42,934 |
| 2013 | -- | $158,816 | $117,250 | $41,566 |
Source: Public Records
Map
Nearby Homes
- 1075 Mill Creek Rd
- 250 Pine Cone Rd
- 1575 Pine Cone Cir
- 1585 Pine Cone Cir
- 198 Country Club Dr Unit 35
- 1580 Pine Cone Cir
- 131 Tramway Rd
- 120 Country Club Dr Unit 37
- 120 Country Club Dr Unit 66
- 120 Country Club Dr Unit 65
- 120 Country Club Dr Unit 27
- 120 Country Club Dr Unit 45
- 321 Ski Way Unit 16
- 321 Ski Way Unit 161
- 321 Ski Way Unit 71
- 321 Ski Way Unit 243
- 321 Ski Way Unit 24
- 333 Ski Way Unit 253
- 1088 Lucerne Way
- 989 Tahoe Blvd Unit 89
- 1075 Mill Creek Rd. Alder Ave Unit 27
- 1067 Mill Creek Rd
- 1070 Tiller Dr
- 1070 Tiller Dr
- 1066 Tiller Dr
- 1074 Tiller Dr
- 1063 Mill Creek Rd
- 1070 Mill Creek Rd
- 1079 Mill Creek Rd
- 1068 Mill Creek Rd
- 1076 Mill Creek Rd
- 1062 Tiller Dr
- 1078 Tiller Dr
- 1064 Mill Creek Rd
- 1080 Mill Creek Rd
- 1059 Mill Creek Rd
- 1081 Mill Creek Rd
- 1060 Tiller Dr
- 1075 Oxen Rd
- 1080 Tiller Dr