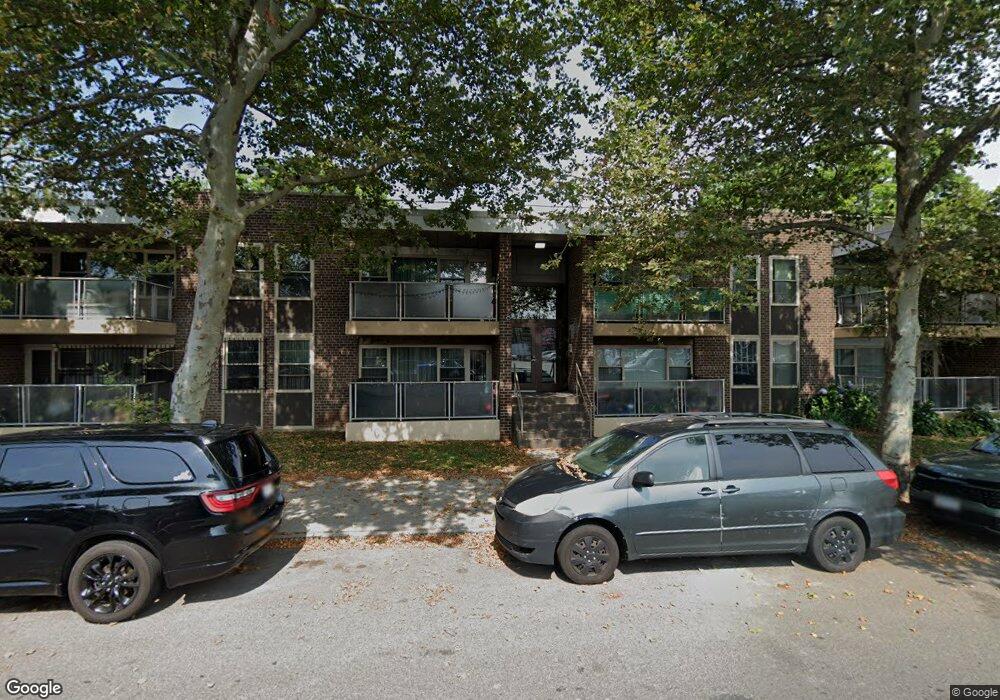
1069 New Jersey Ave Unit 2B Brooklyn, NY 11207
East New York NeighborhoodEstimated Value: $486,441 - $549,000
--
Bed
--
Bath
1,054
Sq Ft
$483/Sq Ft
Est. Value
About This Home
This home is located at 1069 New Jersey Ave Unit 2B, Brooklyn, NY 11207 and is currently estimated at $508,610, approximately $482 per square foot. 1069 New Jersey Ave Unit 2B is a home located in Kings County with nearby schools including P.S. 306 Ethan Allen, Van Siclen Community Middle School, and Achievement First Linden Charter School.
Ownership History
Date
Name
Owned For
Owner Type
Purchase Details
Closed on
Oct 28, 2020
Sold by
Monroe Shonkia and Watson Herbert
Bought by
Scotton Colleen
Current Estimated Value
Home Financials for this Owner
Home Financials are based on the most recent Mortgage that was taken out on this home.
Original Mortgage
$345,950
Outstanding Balance
$307,846
Interest Rate
2.8%
Mortgage Type
New Conventional
Estimated Equity
$200,764
Purchase Details
Closed on
Jan 2, 2015
Sold by
Hp Meadowwood Housing Development Fund C and Tacfield Associates Llc
Bought by
Monroe Shonkia and Watson Herbert
Home Financials for this Owner
Home Financials are based on the most recent Mortgage that was taken out on this home.
Original Mortgage
$299,475
Interest Rate
3.96%
Mortgage Type
New Conventional
Create a Home Valuation Report for This Property
The Home Valuation Report is an in-depth analysis detailing your home's value as well as a comparison with similar homes in the area
Home Values in the Area
Average Home Value in this Area
Purchase History
| Date | Buyer | Sale Price | Title Company |
|---|---|---|---|
| Scotton Colleen | $400,000 | -- | |
| Scotton Colleen | $400,000 | -- | |
| Monroe Shonkia | $309,270 | -- | |
| Monroe Shonkia | $309,270 | -- |
Source: Public Records
Mortgage History
| Date | Status | Borrower | Loan Amount |
|---|---|---|---|
| Open | Scotton Colleen | $345,950 | |
| Closed | Scotton Colleen | $345,950 | |
| Previous Owner | Monroe Shonkia | $299,475 |
Source: Public Records
Tax History Compared to Growth
Tax History
| Year | Tax Paid | Tax Assessment Tax Assessment Total Assessment is a certain percentage of the fair market value that is determined by local assessors to be the total taxable value of land and additions on the property. | Land | Improvement |
|---|---|---|---|---|
| 2025 | $4,953 | $44,504 | $24,900 | $19,604 |
| 2024 | $4,953 | $41,610 | $24,900 | $16,710 |
| 2023 | $3,404 | $39,621 | $24,900 | $14,721 |
| 2022 | $3,123 | $41,614 | $24,900 | $16,714 |
| 2021 | $2,719 | $34,849 | $24,900 | $9,949 |
| 2020 | $2,039 | $39,461 | $24,900 | $14,561 |
| 2019 | $2,399 | $39,461 | $24,900 | $14,561 |
| 2018 | $3,282 | $38,080 | $24,899 | $13,181 |
| 2017 | $2,690 | $37,636 | $24,900 | $12,736 |
| 2016 | $2,020 | $19,710 | $346 | $19,364 |
| 2015 | $728 | $17,002 | $347 | $16,655 |
| 2014 | $728 | $16,612 | $7,401 | $9,211 |
Source: Public Records
Map
Nearby Homes
- 148 Cozine Ave Unit 1 C
- 1069 New Jersey Ave Unit 2B
- 1065 Vermont St Unit 4F
- 1065 Vermont St Unit 4L
- 1065 Vermont St Unit 7A
- 200 Cozine Ave Unit 4F
- 190 Cozine Ave Unit 2L
- 190 Cozine Ave Unit 6
- 12205 Flatlands Ave Unit 1E
- 200 Cozine Ave Unit 9K
- 1019 van Siclen Ave Unit 4D
- 200 Cozine Ave Unit 9F
- 190 Cozine Ave Unit 3B
- 240 Cozine Ave Unit 5B
- 240 Cozine Ave Unit 2B
- 971 Schenck Ave
- 328 Wortman Ave Unit HSE
- 328 Wortman Ave
- 202 Malta St
- 518 Louisiana Ave
- 1069 New Jersey Ave Unit C
- 1069 New Jersey Ave Unit 2B
- 1069 New Jersey Ave Unit 2B
- 1069 New Jersey Ave Unit 2BC
- 1069 New Jersey Ave Unit 2-BB
- 1069 New Jersey Ave Unit BB
- 1063 New Jersey Ave
- 1063 New Jersey Ave Unit 2A
- 1063 New Jersey Ave Unit 2A
- 1063 New Jersey Ave Unit 2A
- 1063 New Jersey Ave Unit 2A
- 1063 New Jersey Ave Unit 2-AA
- 1063 New Jersey Ave Unit CA
- 1063 New Jersey Ave Unit AC
- 1075 New Jersey Ave Unit C
- 1075 New Jersey Ave Unit 2C
- 1075 New Jersey Ave Unit 2C
- 1075 New Jersey Ave Unit 2C
- 1075 New Jersey Ave Unit 2C
- 1075 New Jersey Ave Unit 2-Cb