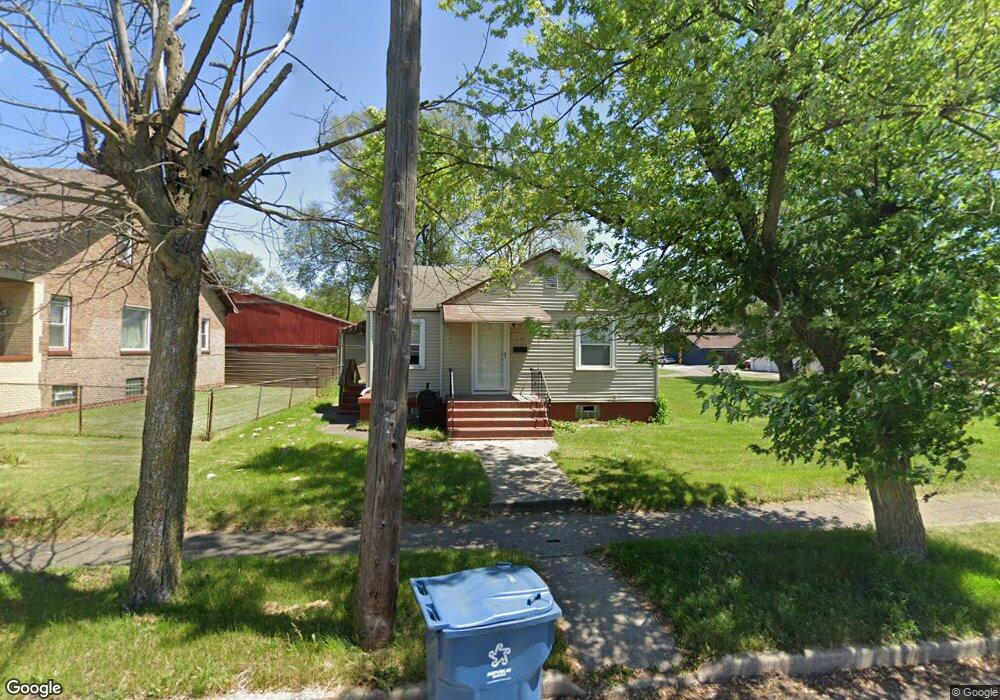
1069 Pierce St Gary, IN 46402
Midtown NeighborhoodEstimated Value: $56,025 - $128,000
2
Beds
2
Baths
756
Sq Ft
$115/Sq Ft
Est. Value
About This Home
This home is located at 1069 Pierce St, Gary, IN 46402 and is currently estimated at $87,006, approximately $115 per square foot. 1069 Pierce St is a home located in Lake County with nearby schools including Beveridge Elementary School, Gary Middle School, and West Side Leadership Academy.
Ownership History
Date
Name
Owned For
Owner Type
Purchase Details
Closed on
Apr 27, 2017
Sold by
James Andrew G and James Susan G
Bought by
Smith Lee H
Current Estimated Value
Purchase Details
Closed on
Jul 16, 2009
Sold by
Cavender Properties Llc
Bought by
James Andrew G and James Susan G
Purchase Details
Closed on
Jun 18, 2009
Sold by
Deutsche Bank National Trust
Bought by
Cavender Properties Llc
Purchase Details
Closed on
May 1, 2009
Sold by
Morgan Brenda and Morgan Brenda R
Bought by
Deutsche Bank National Trust Company
Purchase Details
Closed on
Feb 27, 2007
Sold by
Holmes Robert
Bought by
Morgan Brenda
Home Financials for this Owner
Home Financials are based on the most recent Mortgage that was taken out on this home.
Original Mortgage
$59,500
Interest Rate
6.4%
Mortgage Type
Purchase Money Mortgage
Purchase Details
Closed on
Aug 21, 2006
Sold by
Harden Jennie B and Gassion Stanley
Bought by
Holmes Robert
Create a Home Valuation Report for This Property
The Home Valuation Report is an in-depth analysis detailing your home's value as well as a comparison with similar homes in the area
Home Values in the Area
Average Home Value in this Area
Purchase History
| Date | Buyer | Sale Price | Title Company |
|---|---|---|---|
| Smith Lee H | -- | None Available | |
| James Andrew G | -- | Meridian Title Corp | |
| Cavender Properties Llc | -- | Meridian Title Corp | |
| Deutsche Bank National Trust Company | $3,825 | None Available | |
| Morgan Brenda | -- | None Available | |
| Holmes Robert | $8,000 | None Available |
Source: Public Records
Mortgage History
| Date | Status | Borrower | Loan Amount |
|---|---|---|---|
| Previous Owner | Morgan Brenda | $59,500 |
Source: Public Records
Tax History
| Year | Tax Paid | Tax Assessment Tax Assessment Total Assessment is a certain percentage of the fair market value that is determined by local assessors to be the total taxable value of land and additions on the property. | Land | Improvement |
|---|---|---|---|---|
| 2025 | $963 | $36,600 | $6,200 | $30,400 |
| 2024 | $2,927 | $33,000 | $6,200 | $26,800 |
| 2023 | $648 | $33,200 | $7,000 | $26,200 |
| 2022 | $648 | $25,300 | $2,700 | $22,600 |
| 2021 | $597 | $23,300 | $2,700 | $20,600 |
| 2020 | $633 | $24,700 | $2,700 | $22,000 |
| 2019 | $625 | $26,600 | $2,700 | $23,900 |
| 2018 | $780 | $33,700 | $2,700 | $31,000 |
| 2017 | $802 | $34,100 | $2,700 | $31,400 |
| 2016 | $824 | $35,600 | $2,700 | $32,900 |
| 2014 | $976 | $41,100 | $3,200 | $37,900 |
| 2013 | $1,669 | $73,200 | $3,200 | $70,000 |
Source: Public Records
Map
Nearby Homes
- 1109 W 11th Ave
- 1141 Fillmore St
- 833 Tyler St
- 1072 Van Buren St
- 1165 Harrison St
- 851 Johnson St
- 1177 Harrison St
- 749 Buchanan St
- 743 Buchanan St
- 1123 - 1125 Van Buren St
- 824 Johnson St
- 1148 Jackson St
- 1105 W 15th Ave
- 733 Lincoln St
- 755 Johnson St
- 1384 Harrison St
- 1686 W 10th Place
- 1665 W 12th Ave
- 1695 W 10th Ave
- 1005 Garfield St
- 1061 Pierce St
- 1073 Pierce St
- 1068 Fillmore St
- 1064 Fillmore St
- 1072 Fillmore St
- 1060 Fillmore St
- 1056 Fillmore St
- 1047 Pierce St
- 1124 W 11th Ave
- 1066 Pierce St
- 1116 W 11th Ave
- 1130 W 11th Ave
- 1074 Pierce St
- 1056 Pierce St
- 1112 W 11th Ave
- 1052 Pierce St
- 1048 Fillmore St
- 1041 Pierce St
- 1048 Pierce St
- 1212 W 11th Ave
Your Personal Tour Guide
Ask me questions while you tour the home.