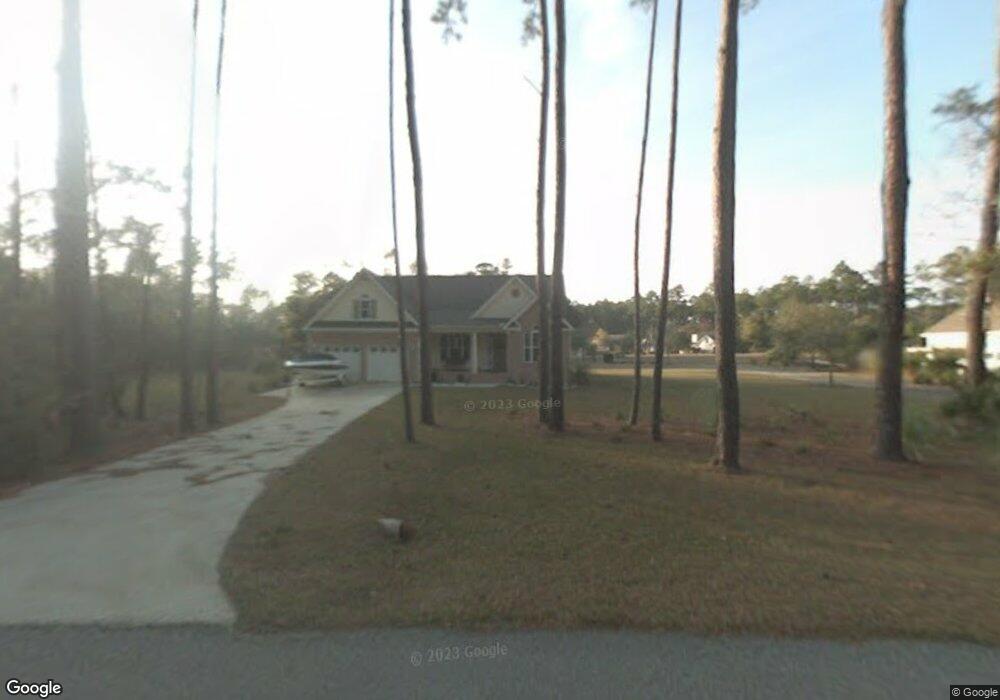
1069 Winterberry Ct NE Townsend, GA 31331
Estimated Value: $429,805 - $593,000
3
Beds
3
Baths
2,155
Sq Ft
$236/Sq Ft
Est. Value
About This Home
This home is located at 1069 Winterberry Ct NE, Townsend, GA 31331 and is currently estimated at $509,451, approximately $236 per square foot. 1069 Winterberry Ct NE is a home located in McIntosh County with nearby schools including Todd Grant Elementary School, McIntosh County Middle School, and McIntosh County Academy.
Ownership History
Date
Name
Owned For
Owner Type
Purchase Details
Closed on
May 22, 2025
Sold by
Swords Anna C
Bought by
Swords Joseph S
Current Estimated Value
Purchase Details
Closed on
Mar 17, 2021
Sold by
Baxter John
Bought by
Swords Joseph S and Swords Anna C
Home Financials for this Owner
Home Financials are based on the most recent Mortgage that was taken out on this home.
Original Mortgage
$272,422
Interest Rate
2.8%
Mortgage Type
VA
Purchase Details
Closed on
Jun 12, 2009
Sold by
Stickley Harry P
Bought by
Baxter John
Purchase Details
Closed on
Sep 30, 2005
Sold by
Ckg Investments Llc
Bought by
Stickley Harry P and Stickley Sue Ellen
Purchase Details
Closed on
Jul 5, 2005
Sold by
Guyon Christopher K
Bought by
Ckg Investments Inc
Purchase Details
Closed on
Aug 25, 2004
Sold by
Ckg Investments Inc
Bought by
Guyon Christopher K
Purchase Details
Closed on
May 7, 2004
Sold by
Shives John F and Shives Linda K
Bought by
Ckg Investments Inc
Purchase Details
Closed on
Feb 28, 2000
Sold by
Belvedere Island
Bought by
Shives Shives F and Shives Joh
Create a Home Valuation Report for This Property
The Home Valuation Report is an in-depth analysis detailing your home's value as well as a comparison with similar homes in the area
Purchase History
| Date | Buyer | Sale Price | Title Company |
|---|---|---|---|
| Swords Joseph S | -- | -- | |
| Swords Joseph S | $282,500 | -- | |
| Baxter John | $255,000 | -- | |
| Stickley Harry P | $254,500 | -- | |
| Ckg Investments Inc | -- | -- | |
| Guyon Christopher K | -- | -- | |
| Ckg Investments Inc | $24,000 | -- | |
| Shives Shives F | $14,900 | -- |
Source: Public Records
Mortgage History
| Date | Status | Borrower | Loan Amount |
|---|---|---|---|
| Previous Owner | Swords Joseph S | $272,422 |
Source: Public Records
Tax History
| Year | Tax Paid | Tax Assessment Tax Assessment Total Assessment is a certain percentage of the fair market value that is determined by local assessors to be the total taxable value of land and additions on the property. | Land | Improvement |
|---|---|---|---|---|
| 2025 | $2,242 | $161,960 | $14,000 | $147,960 |
| 2024 | $2,138 | $151,320 | $14,000 | $137,320 |
| 2023 | $2,145 | $140,640 | $9,600 | $131,040 |
| 2022 | $2,144 | $114,920 | $6,800 | $108,120 |
| 2021 | $1,902 | $71,560 | $8,000 | $63,560 |
| 2020 | $1,986 | $69,000 | $8,000 | $61,000 |
| 2019 | $2,008 | $75,560 | $6,000 | $69,560 |
| 2018 | $2,045 | $76,960 | $7,400 | $69,560 |
| 2017 | $1,851 | $63,920 | $10,000 | $53,920 |
| 2016 | $1,851 | $63,920 | $10,000 | $53,920 |
| 2015 | $2,016 | $70,889 | $10,000 | $60,890 |
| 2014 | -- | $70,890 | $10,000 | $60,890 |
Source: Public Records
Map
Nearby Homes
- 0 Winterberry Ct Unit LOT 181
- 1186 Winterberry Ct NE
- 1140 Winterberry Dr
- 1 Belvedere Dr
- Lot #151 Winterberry Ln NE
- Lot 125 Sapelo Cir
- Lot 138 Sapelo Cir
- 2416 Belvedere Dr NE
- 138 Sapelo Cir
- 137 Sapelo Cir
- 1121 Fair Hope Dr NE
- 0 Sapelo Cir Unit 1657610
- 0 Sapelo Cir Unit SA342517
- 132 Sapelo Cir NE
- 1359 Sapelo Cir NE
- 1231 Riverpoint Ln NE
- Lot 1 Belvedere Dr
- Lot 214 Riverpoint Ln NE
- 1062 Refuge Ct NE
- 1069 Fair Hope Dr NE
- 1069 Winterberry Ct NE
- 1069 Winterberry Ct NE
- 1069 Winterberry Ct NE
- 169 Winterberry Ct Unit A
- 169 Winterberry Ct
- 181 Winterberry Ct
- N/A Winterberry Ct
- 167 Winterberry Ct
- Lot 205 Winterberry Ct
- 0 Winterberry Ct Unit 156 8450386
- 0 Winterberry Ct Unit LOT 186 3147898
- 0 Winterberry Ct Unit LOT 186 7017585
- 0 Winterberry Ct Unit 158 8988777
- 0 Winterberry Ct Unit 202438
- 0 Winterberry Ct Unit 198760
- 1049 Winterberry Ct NE
- Lot 175 Winterberry Ct NE
- 1103 Winterberry Ct NE
- 1103 Winterberry Ct NE
- 1103 Winterberry Ct NE
Your Personal Tour Guide
Ask me questions while you tour the home.