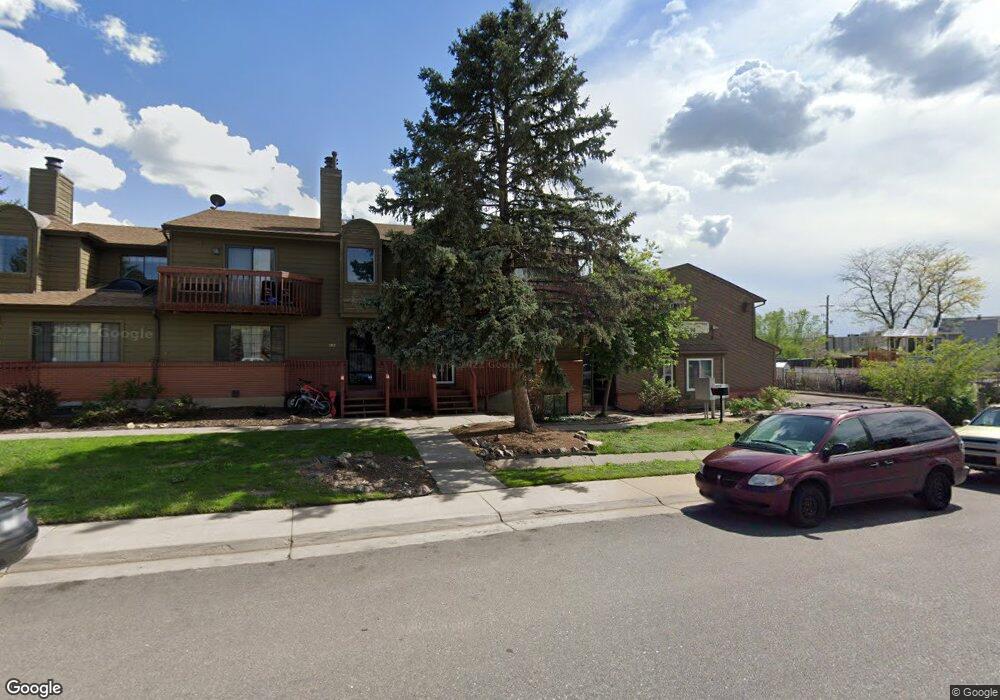
10694 E Asbury Ave Unit 119 Aurora, CO 80014
Village East NeighborhoodEstimated Value: $362,000 - $419,000
3
Beds
3
Baths
2,165
Sq Ft
$177/Sq Ft
Est. Value
About This Home
This home is located at 10694 E Asbury Ave Unit 119, Aurora, CO 80014 and is currently estimated at $382,966, approximately $176 per square foot. 10694 E Asbury Ave Unit 119 is a home located in Arapahoe County with nearby schools including Ponderosa Elementary School, Prairie Middle School, and Overland High School.
Ownership History
Date
Name
Owned For
Owner Type
Purchase Details
Closed on
Feb 11, 2020
Sold by
Harris Crawford B
Bought by
Harris Carwford B
Current Estimated Value
Purchase Details
Closed on
Sep 20, 2019
Sold by
Duvall James E and Duvall Jill L
Bought by
Harris Crawford B
Home Financials for this Owner
Home Financials are based on the most recent Mortgage that was taken out on this home.
Original Mortgage
$280,810
Outstanding Balance
$244,347
Interest Rate
3.6%
Mortgage Type
VA
Estimated Equity
$138,619
Purchase Details
Closed on
Nov 10, 2014
Sold by
Livingston Jonna L and Livingston Debbie C
Bought by
Duvall James E and Duvall Jill L
Home Financials for this Owner
Home Financials are based on the most recent Mortgage that was taken out on this home.
Original Mortgage
$116,000
Interest Rate
4.21%
Mortgage Type
New Conventional
Purchase Details
Closed on
Sep 30, 1997
Sold by
Cedar Crest Llc
Bought by
Livingston Jonna L and Livingston Debbie C
Create a Home Valuation Report for This Property
The Home Valuation Report is an in-depth analysis detailing your home's value as well as a comparison with similar homes in the area
Home Values in the Area
Average Home Value in this Area
Purchase History
| Date | Buyer | Sale Price | Title Company |
|---|---|---|---|
| Harris Carwford B | -- | None Available | |
| Harris Crawford B | $274,900 | Heritage Title Company | |
| Duvall James E | $145,000 | Fidelity National Title Ins | |
| Livingston Jonna L | $131,000 | -- |
Source: Public Records
Mortgage History
| Date | Status | Borrower | Loan Amount |
|---|---|---|---|
| Open | Harris Crawford B | $280,810 | |
| Previous Owner | Duvall James E | $116,000 |
Source: Public Records
Tax History
| Year | Tax Paid | Tax Assessment Tax Assessment Total Assessment is a certain percentage of the fair market value that is determined by local assessors to be the total taxable value of land and additions on the property. | Land | Improvement |
|---|---|---|---|---|
| 2025 | $1,542 | $25,906 | -- | -- |
| 2024 | $1,359 | $19,651 | -- | -- |
| 2023 | $1,359 | $19,651 | $0 | $0 |
| 2022 | $1,390 | $19,196 | $0 | $0 |
| 2021 | $1,399 | $19,196 | $0 | $0 |
| 2020 | $1,206 | $16,788 | $0 | $0 |
| 2019 | $1,163 | $16,788 | $0 | $0 |
| 2018 | $989 | $13,414 | $0 | $0 |
| 2017 | $975 | $13,414 | $0 | $0 |
| 2016 | $849 | $10,961 | $0 | $0 |
| 2015 | $808 | $10,961 | $0 | $0 |
| 2014 | -- | $9,807 | $0 | $0 |
| 2013 | -- | $11,220 | $0 | $0 |
Source: Public Records
Map
Nearby Homes
- 2218 S Iola St
- 1967 S Kingston Ct
- 10320 E Jewell Ave Unit 60
- 2225 S Iola St
- 10310 E Jewell Ave Unit 57
- 1968 S Kingston Ct
- 1958 S Kingston Ct
- 2154 S Fulton Cir Unit 202
- 9901 E Evans Ave Unit 5D
- 9901 E Evans Ave Unit 14D
- 9901 E Evans Ave Unit 33D
- 9901 E Evans Ave Unit 22B
- 9901 E Evans Ave Unit 13B
- 9901 E Evans Ave Unit 4D
- 11183 E Baltic Place
- 1685 S Kenton Way
- 10001 E Evans Ave Unit 47A
- 10001 E Evans Ave Unit 42B
- 10001 E Evans Ave Unit 82B
- 2341 S Kenton St
- 10694 E Asbury Ave
- 10694 E Asbury Ave Unit 118
- 10694 E Asbury Ave Unit 117
- 10694 E Asbury Ave Unit 116
- 10694 E Asbury Ave Unit 115
- 10694 E Asbury Ave Unit 114
- 10694 E Asbury Ave Unit 113
- 10694 E Asbury Ave Unit 112
- 10694 E Asbury Ave Unit 111
- 10694 E Asbury Ave Unit 110
- 10694 E Asbury Ave Unit 109
- 10694 E Asbury Ave Unit 108
- 10694 E Asbury Ave Unit 107
- 10694 E Asbury Ave Unit 106
- 10694 E Asbury Ave Unit 105
- 10694 E Asbury Ave Unit 104
- 10694 E Asbury Ave Unit 103
- 10694 E Asbury Ave Unit 102
- 10694 E Asbury Ave Unit 101
- 2007 S Ironton Ct
Your Personal Tour Guide
Ask me questions while you tour the home.