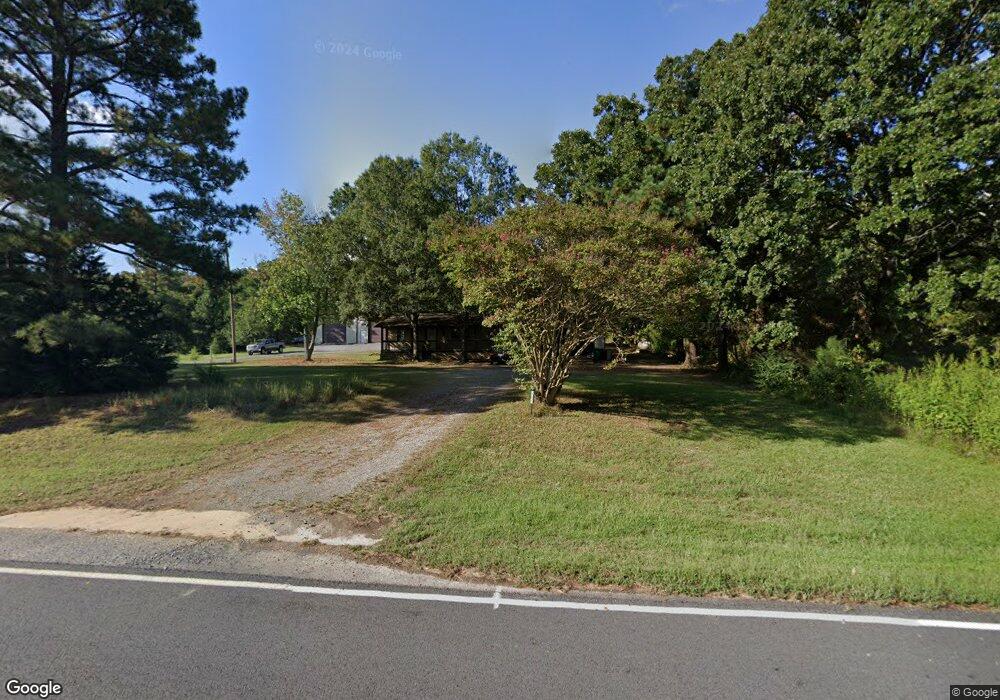
107 Acklin Gap Rd Conway, AR 72032
Estimated Value: $160,583 - $263,000
Studio
1
Bath
720
Sq Ft
$284/Sq Ft
Est. Value
About This Home
This home is located at 107 Acklin Gap Rd, Conway, AR 72032 and is currently estimated at $204,528, approximately $284 per square foot. 107 Acklin Gap Rd is a home located in Faulkner County with nearby schools including Theodore Jones Elementary School, Conway Junior High School, and Conway High School.
Ownership History
Date
Name
Owned For
Owner Type
Purchase Details
Closed on
Nov 12, 2019
Sold by
Southerland Judd A
Bought by
Southerland Judd Alan
Current Estimated Value
Home Financials for this Owner
Home Financials are based on the most recent Mortgage that was taken out on this home.
Original Mortgage
$117,600
Outstanding Balance
$79,308
Interest Rate
3.65%
Mortgage Type
New Conventional
Estimated Equity
$125,220
Purchase Details
Closed on
Dec 10, 2012
Sold by
Southerland Judd A
Bought by
Sarah Jane Bailey Southerland Revocable
Purchase Details
Closed on
Feb 26, 2008
Bought by
Southerland, Sarah J B Rev Trs
Create a Home Valuation Report for This Property
The Home Valuation Report is an in-depth analysis detailing your home's value as well as a comparison with similar homes in the area
Home Values in the Area
Average Home Value in this Area
Purchase History
| Date | Buyer | Sale Price | Title Company |
|---|---|---|---|
| Southerland Judd Alan | -- | Lenders Title Company | |
| Sarah Jane Bailey Southerland Revocable | -- | Lenders Title Co | |
| Southerland Judd A | -- | Lenders Title Co | |
| Southerland, Sarah J B Rev Trs | -- | -- |
Source: Public Records
Mortgage History
| Date | Status | Borrower | Loan Amount |
|---|---|---|---|
| Open | Southerland Judd Alan | $117,600 |
Source: Public Records
Tax History
| Year | Tax Paid | Tax Assessment Tax Assessment Total Assessment is a certain percentage of the fair market value that is determined by local assessors to be the total taxable value of land and additions on the property. | Land | Improvement |
|---|---|---|---|---|
| 2025 | $1,139 | $34,050 | $4,100 | $29,950 |
| 2024 | $1,088 | $34,050 | $4,100 | $29,950 |
| 2023 | $1,036 | $24,280 | $4,100 | $20,180 |
| 2022 | $717 | $24,280 | $4,100 | $20,180 |
| 2021 | $632 | $24,280 | $4,100 | $20,180 |
| 2020 | $587 | $19,430 | $3,110 | $16,320 |
| 2019 | $246 | $12,070 | $3,110 | $8,960 |
| 2018 | $218 | $11,030 | $3,110 | $7,920 |
| 2017 | $196 | $11,030 | $3,110 | $7,920 |
| 2016 | $175 | $10,000 | $3,110 | $6,890 |
| 2015 | $437 | $9,420 | $3,710 | $5,710 |
| 2014 | $147 | $9,420 | $3,710 | $5,710 |
Source: Public Records
Map
Nearby Homes
- 10 Kim Dr
- 3755 Lazy Creek Trail
- 175 Acklin Gap Rd
- 3610 Breezy Cir
- 32 Hardin Ln
- 2060 Shadow Falls Dr
- 17 Oak Creek Dr
- 1950 Shadow Falls Dr
- 5 Treasure Hills Rd
- 84 E Cadron Ridge Rd
- 2 Lake Point Dr
- Lot 32 Summit Addition Ph 1
- 185 Lower Ridge Rd
- 70 Beaverfork Rd
- 74 Hays Hill Rd
- 16 Pinecrest Ct
- 6 Cedar Hill Rd
- 16 Royal Vista Cove
- 3030 Plateau Dr
- 23 Barn Cat Way
- 110 Acklin Gap Rd
- 115 Acklin Gap Rd
- 123 Acklin Gap Rd
- 19 Ridgeview Dr
- 104 Acklin Gap Rd
- 8 Ruff Rd
- 29 Ridgeview Dr
- 89 Acklin Gap Rd
- 10 Ruff Rd
- 85 Acklin Gap Rd
- 127 Acklin Gap Rd
- 20 Ridgeview Dr
- 0 Ridgeview Dr
- 30 Ridgeview Dr
- 39 Ridgeview Dr
- 59 Ridgeview Dr
- 49 Ridgeview Dr
- 40 Ridgeview Dr
- 79 Acklin Gap Rd
- 11 Wright Estate Dr
Your Personal Tour Guide
Ask me questions while you tour the home.