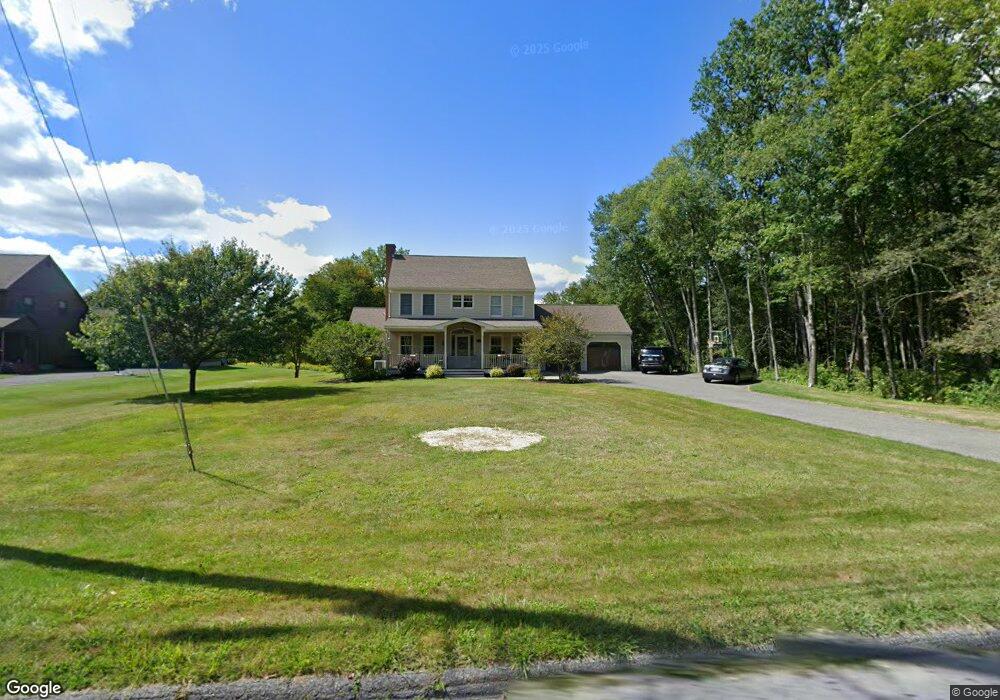
107 Anthony Rd Dalton, MA 01226
Estimated Value: $531,000 - $893,000
3
Beds
4
Baths
4,200
Sq Ft
$163/Sq Ft
Est. Value
About This Home
This home is located at 107 Anthony Rd, Dalton, MA 01226 and is currently estimated at $683,035, approximately $162 per square foot. 107 Anthony Rd is a home located in Berkshire County with nearby schools including Wahconah Regional High School and St. Agnes Academy.
Ownership History
Date
Name
Owned For
Owner Type
Purchase Details
Closed on
Nov 12, 2021
Sold by
Culliton James W
Bought by
James W Culliton Jr Ret
Current Estimated Value
Purchase Details
Closed on
Dec 30, 2008
Sold by
Culliton James W and Culliton Kathleen J
Bought by
Culliton James W
Create a Home Valuation Report for This Property
The Home Valuation Report is an in-depth analysis detailing your home's value as well as a comparison with similar homes in the area
Home Values in the Area
Average Home Value in this Area
Purchase History
| Date | Buyer | Sale Price | Title Company |
|---|---|---|---|
| James W Culliton Jr Ret | -- | None Available | |
| James W Culliton Jr Ret | -- | None Available | |
| Culliton James W | -- | -- | |
| Culliton James W | -- | -- |
Source: Public Records
Mortgage History
| Date | Status | Borrower | Loan Amount |
|---|---|---|---|
| Previous Owner | Culliton James W | $85,000 | |
| Previous Owner | Culliton James W | $94,500 | |
| Previous Owner | Culliton James W | $95,000 |
Source: Public Records
Tax History Compared to Growth
Tax History
| Year | Tax Paid | Tax Assessment Tax Assessment Total Assessment is a certain percentage of the fair market value that is determined by local assessors to be the total taxable value of land and additions on the property. | Land | Improvement |
|---|---|---|---|---|
| 2025 | $10,026 | $553,000 | $88,800 | $464,200 |
| 2024 | $9,912 | $544,600 | $81,700 | $462,900 |
| 2023 | $9,010 | $468,300 | $74,400 | $393,900 |
| 2022 | $8,257 | $398,100 | $74,400 | $323,700 |
| 2021 | $8,400 | $390,500 | $69,600 | $320,900 |
| 2020 | $7,546 | $371,900 | $69,600 | $302,300 |
| 2019 | $7,340 | $376,800 | $67,900 | $308,900 |
| 2018 | $7,265 | $364,900 | $67,900 | $297,000 |
| 2017 | $7,270 | $365,900 | $67,900 | $298,000 |
| 2016 | $7,183 | $365,900 | $67,900 | $298,000 |
| 2015 | $7,021 | $360,600 | $67,900 | $292,700 |
Source: Public Records
Map
Nearby Homes