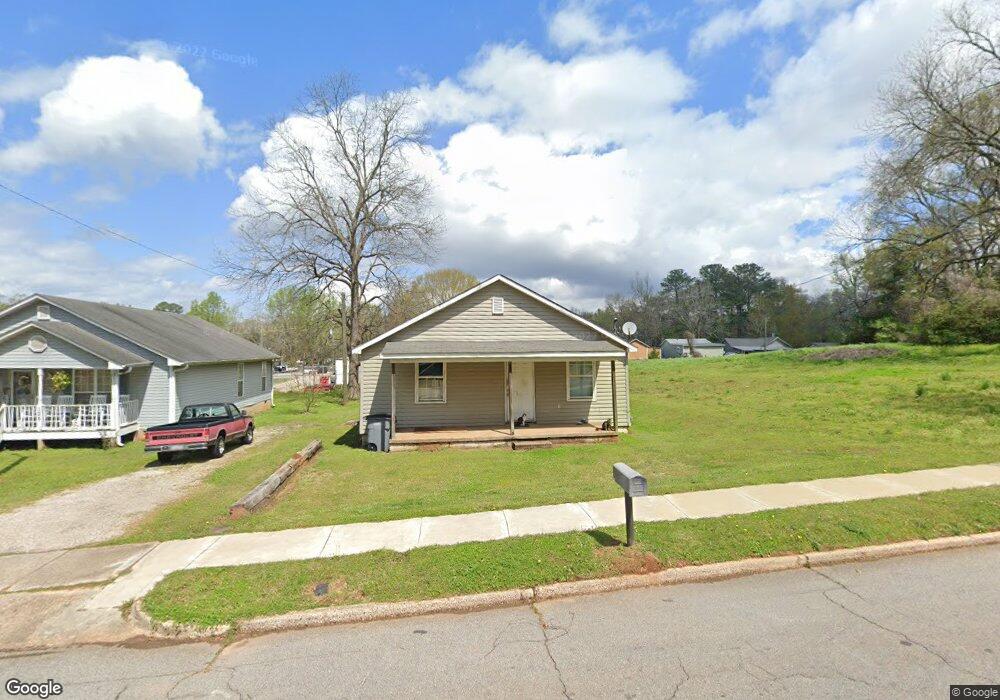
107 Bell St Lagrange, GA 30241
Estimated Value: $56,075 - $192,000
2
Beds
1
Bath
800
Sq Ft
$137/Sq Ft
Est. Value
About This Home
This home is located at 107 Bell St, Lagrange, GA 30241 and is currently estimated at $109,519, approximately $136 per square foot. 107 Bell St is a home located in Troup County with nearby schools including Callaway Elementary School, Hogansville Elementary School, and Callaway Middle School.
Ownership History
Date
Name
Owned For
Owner Type
Purchase Details
Closed on
Sep 13, 2012
Sold by
Sec Of Housing & U
Bought by
Khokhar Zain Ahmed
Current Estimated Value
Purchase Details
Closed on
Jun 5, 2012
Sold by
Bank Of America
Bought by
Sec Of Housing & Urban
Purchase Details
Closed on
Jan 30, 2006
Sold by
Morman R Algie
Bought by
Huzzie Brandon D and Dennis Latisha L
Purchase Details
Closed on
Mar 14, 2005
Sold by
Gillett Derek
Bought by
Morman R Algie
Purchase Details
Closed on
Mar 1, 2002
Sold by
Phillip David Key
Bought by
Gillett Derek
Purchase Details
Closed on
Mar 22, 2001
Sold by
Community Bank & Trust
Bought by
Phillip David Key
Purchase Details
Closed on
Mar 7, 2001
Sold by
Jerry C Averett
Bought by
Community Bank & Trust
Purchase Details
Closed on
Oct 15, 1979
Sold by
Fletcher Alice Etal
Bought by
Jerry C Averett
Purchase Details
Closed on
Sep 15, 1978
Sold by
Mallory Mrs Arthur E
Bought by
Fletcher Alice Etal
Purchase Details
Closed on
Jan 1, 1945
Sold by
Johnson J Forest
Bought by
Mallory Mrs Arthur E
Create a Home Valuation Report for This Property
The Home Valuation Report is an in-depth analysis detailing your home's value as well as a comparison with similar homes in the area
Home Values in the Area
Average Home Value in this Area
Purchase History
| Date | Buyer | Sale Price | Title Company |
|---|---|---|---|
| Khokhar Zain Ahmed | $9,200 | -- | |
| Sec Of Housing & Urban | $69,168 | -- | |
| Bank Of America | $69,168 | -- | |
| Huzzie Brandon D | $49,900 | -- | |
| Morman R Algie | $26,000 | -- | |
| Gillett Derek | $34,900 | -- | |
| Phillip David Key | -- | -- | |
| Community Bank & Trust | $12,500 | -- | |
| Jerry C Averett | -- | -- | |
| Fletcher Alice Etal | -- | -- | |
| Mallory Mrs Arthur E | -- | -- |
Source: Public Records
Tax History Compared to Growth
Tax History
| Year | Tax Paid | Tax Assessment Tax Assessment Total Assessment is a certain percentage of the fair market value that is determined by local assessors to be the total taxable value of land and additions on the property. | Land | Improvement |
|---|---|---|---|---|
| 2024 | $393 | $14,400 | $3,000 | $11,400 |
| 2023 | $368 | $13,480 | $3,000 | $10,480 |
| 2022 | $359 | $12,880 | $3,000 | $9,880 |
| 2021 | $297 | $9,840 | $1,480 | $8,360 |
| 2020 | $297 | $9,840 | $1,480 | $8,360 |
| 2019 | $280 | $9,280 | $1,480 | $7,800 |
| 2018 | $280 | $9,280 | $1,480 | $7,800 |
| 2017 | $280 | $9,280 | $1,480 | $7,800 |
| 2016 | $278 | $9,233 | $1,500 | $7,733 |
| 2015 | $279 | $9,233 | $1,500 | $7,733 |
| 2014 | $267 | $8,826 | $1,500 | $7,326 |
| 2013 | -- | $12,082 | $3,400 | $8,682 |
Source: Public Records
Map
Nearby Homes
- 101 Cedar St
- 109 Bell St
- 0 Bagley St
- 0 Boggs St Unit 10550243
- 0 Boggs St Unit 10550231
- 0 Boggs St Unit 10550239
- 0 Boggs St Unit 10550250
- 304 Butler St
- 1191 Whitesville St
- 501 Milam St
- 901 Whiteline St
- W W Crovat St
- 1201 Whitesville St
- 0 E Fendig St
- 113 E Fendig St
- 303 E Mulberry St
- 1186 Lindsey St
- 1404-1406 Hamilton
- 311 Colquitt St
- 1404 Hamilton Rd