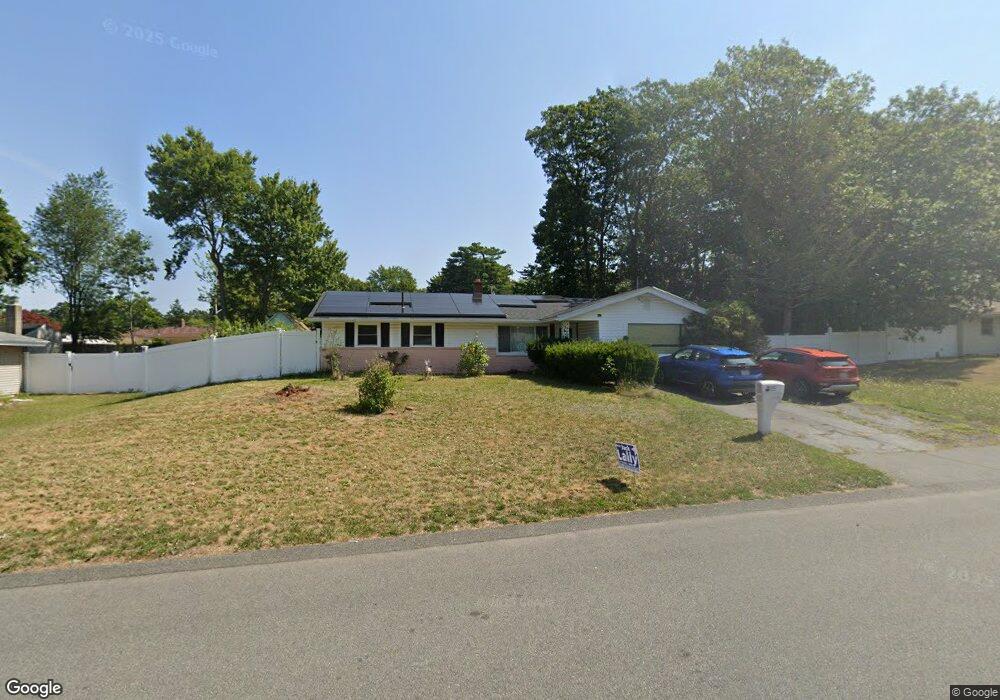
107 Bourne St Brockton, MA 02302
Montello NeighborhoodEstimated Value: $498,000 - $524,000
4
Beds
2
Baths
1,385
Sq Ft
$372/Sq Ft
Est. Value
About This Home
This home is located at 107 Bourne St, Brockton, MA 02302 and is currently estimated at $515,420, approximately $372 per square foot. 107 Bourne St is a home located in Plymouth County with nearby schools including Brookfield Elementary School, Downey Elementary School, and Ashfield Middle School.
Ownership History
Date
Name
Owned For
Owner Type
Purchase Details
Closed on
Sep 3, 2009
Sold by
Zychiewicz Boguslaw and Zychiewicz Radoslawa
Bought by
Porzelt Mark E and Porzelt Kathleen
Current Estimated Value
Home Financials for this Owner
Home Financials are based on the most recent Mortgage that was taken out on this home.
Original Mortgage
$157,600
Interest Rate
5.21%
Mortgage Type
Purchase Money Mortgage
Purchase Details
Closed on
May 26, 1999
Sold by
Keith Ronald and Keith Rosa M
Bought by
Zychiewicz Boguslaw and Zychiewicz Radoslawa
Purchase Details
Closed on
Jan 31, 1989
Sold by
Lewis Janice C
Bought by
Keith Rosa M
Create a Home Valuation Report for This Property
The Home Valuation Report is an in-depth analysis detailing your home's value as well as a comparison with similar homes in the area
Home Values in the Area
Average Home Value in this Area
Purchase History
| Date | Buyer | Sale Price | Title Company |
|---|---|---|---|
| Porzelt Mark E | $197,000 | -- | |
| Zychiewicz Boguslaw | $116,900 | -- | |
| Keith Rosa M | $115,000 | -- |
Source: Public Records
Mortgage History
| Date | Status | Borrower | Loan Amount |
|---|---|---|---|
| Open | Keith Rosa M | $160,000 | |
| Closed | Keith Rosa M | $157,600 | |
| Previous Owner | Keith Rosa M | $172,000 |
Source: Public Records
Tax History Compared to Growth
Tax History
| Year | Tax Paid | Tax Assessment Tax Assessment Total Assessment is a certain percentage of the fair market value that is determined by local assessors to be the total taxable value of land and additions on the property. | Land | Improvement |
|---|---|---|---|---|
| 2025 | $5,302 | $437,800 | $159,500 | $278,300 |
| 2024 | $5,034 | $418,800 | $159,500 | $259,300 |
| 2023 | $4,855 | $374,000 | $109,800 | $264,200 |
| 2022 | $4,423 | $316,600 | $99,800 | $216,800 |
| 2021 | $4,292 | $296,000 | $92,400 | $203,600 |
| 2020 | $4,316 | $284,900 | $81,200 | $203,700 |
| 2019 | $3,997 | $257,200 | $77,400 | $179,800 |
| 2018 | $3,819 | $237,800 | $77,400 | $160,400 |
| 2017 | $3,404 | $211,400 | $77,400 | $134,000 |
| 2016 | $3,456 | $199,100 | $73,800 | $125,300 |
| 2015 | $3,029 | $166,900 | $73,800 | $93,100 |
| 2014 | $3,004 | $165,700 | $73,800 | $91,900 |
Source: Public Records
Map
Nearby Homes