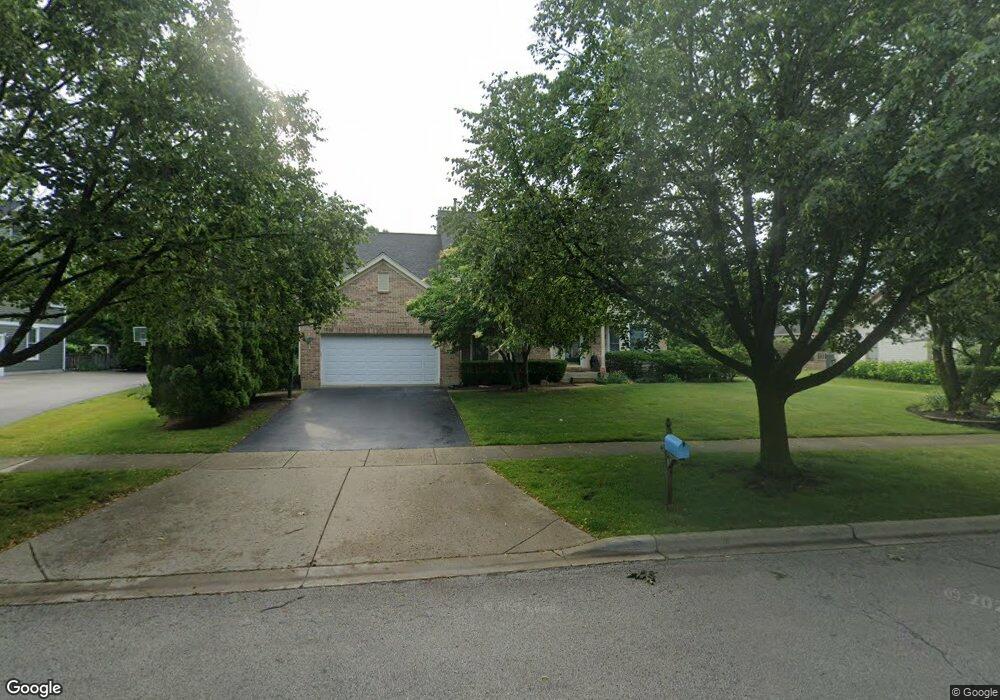
107 Brook Hill Ln Vernon Hills, IL 60061
Estimated Value: $680,328 - $802,000
4
Beds
3
Baths
2,693
Sq Ft
$277/Sq Ft
Est. Value
About This Home
This home is located at 107 Brook Hill Ln, Vernon Hills, IL 60061 and is currently estimated at $746,332, approximately $277 per square foot. 107 Brook Hill Ln is a home located in Lake County with nearby schools including Laura B. Sprague School, Half Day School, and Daniel Wright Junior High School.
Ownership History
Date
Name
Owned For
Owner Type
Purchase Details
Closed on
Jun 21, 2006
Sold by
Matye Eric G
Bought by
Kim Sonia and An Gary
Current Estimated Value
Home Financials for this Owner
Home Financials are based on the most recent Mortgage that was taken out on this home.
Original Mortgage
$417,000
Outstanding Balance
$247,350
Interest Rate
6.73%
Mortgage Type
Purchase Money Mortgage
Estimated Equity
$498,982
Purchase Details
Closed on
Dec 19, 1997
Sold by
Perng Yuh Guang and Perng Chin
Bought by
Matye Eric G
Home Financials for this Owner
Home Financials are based on the most recent Mortgage that was taken out on this home.
Original Mortgage
$80,000
Interest Rate
7.35%
Purchase Details
Closed on
Nov 15, 1996
Sold by
Callahan Edward J and Callahan Rosalyn
Bought by
Perng Yuh Guang and Perng Chin Chin F
Home Financials for this Owner
Home Financials are based on the most recent Mortgage that was taken out on this home.
Original Mortgage
$200,000
Interest Rate
5.75%
Create a Home Valuation Report for This Property
The Home Valuation Report is an in-depth analysis detailing your home's value as well as a comparison with similar homes in the area
Home Values in the Area
Average Home Value in this Area
Purchase History
| Date | Buyer | Sale Price | Title Company |
|---|---|---|---|
| Kim Sonia | $620,000 | St | |
| Matye Eric G | $363,000 | Imperial Land Title Inc | |
| Perng Yuh Guang | $350,000 | Imperial Land Title Inc |
Source: Public Records
Mortgage History
| Date | Status | Borrower | Loan Amount |
|---|---|---|---|
| Open | Kim Sonia | $417,000 | |
| Previous Owner | Matye Eric G | $80,000 | |
| Previous Owner | Perng Yuh Guang | $200,000 |
Source: Public Records
Tax History Compared to Growth
Tax History
| Year | Tax Paid | Tax Assessment Tax Assessment Total Assessment is a certain percentage of the fair market value that is determined by local assessors to be the total taxable value of land and additions on the property. | Land | Improvement |
|---|---|---|---|---|
| 2024 | $15,592 | $183,851 | $43,418 | $140,433 |
| 2023 | $14,858 | $173,477 | $40,968 | $132,509 |
| 2022 | $14,858 | $166,156 | $39,239 | $126,917 |
| 2021 | $14,274 | $164,365 | $38,816 | $125,549 |
| 2020 | $13,911 | $164,925 | $38,948 | $125,977 |
| 2019 | $13,504 | $164,317 | $38,804 | $125,513 |
| 2018 | $15,101 | $187,765 | $38,349 | $149,416 |
| 2017 | $14,927 | $183,382 | $37,454 | $145,928 |
| 2016 | $14,339 | $175,603 | $35,865 | $139,738 |
| 2015 | $14,105 | $164,223 | $33,541 | $130,682 |
| 2014 | $13,212 | $154,546 | $36,023 | $118,523 |
| 2012 | $12,915 | $154,856 | $36,095 | $118,761 |
Source: Public Records
Map
Nearby Homes
- 124 Midway Ln
- 116 S Deerpath Dr
- 306 Lasalle St
- 339 Lasalle St
- 219 Abilene Ln
- 128 Lilly Ct
- 221 Alexandria Dr
- 100 Lilly Ct
- 468 Woodland Chase Ln
- 14 Edgewood Rd
- 361 Ashwood Ct Unit 75D
- 382 Birchwood Ct Unit 82C
- 190 Southgate Dr
- 15 Tanwood Ct Unit 52B
- 336 Westwood Ct Unit 42D
- 384 Woodland Chase Ln
- 399 Sislow Ln
- 410 Sislow Ln
- 307 Albright Ct
- 233 Harvest Ct
- 91 Brook Hill Ln
- 123 Brook Hill Ln
- 139 Brook Hill Ln
- 96 Brook Hill Ln Unit 2
- 75 Brook Hill Ln Unit 2
- 124 Brook Hill Ln
- 80 Brook Hill Ln
- 138 Brook Hill Ln
- 155 Brook Hill Ln
- 61 Brook Hill Ln
- 83 S Old Creek Rd
- 62 Brook Hill Ln
- 152 Brook Hill Ln Unit 2
- 97 S Old Creek Rd Unit 2
- 109 S Old Creek Rd
- 171 Brook Hill Ln
- 125 S Old Creek Rd
- 35 S Old Creek Rd
- 166 Brook Hill Ln Unit 2
- 141 S Old Creek Rd