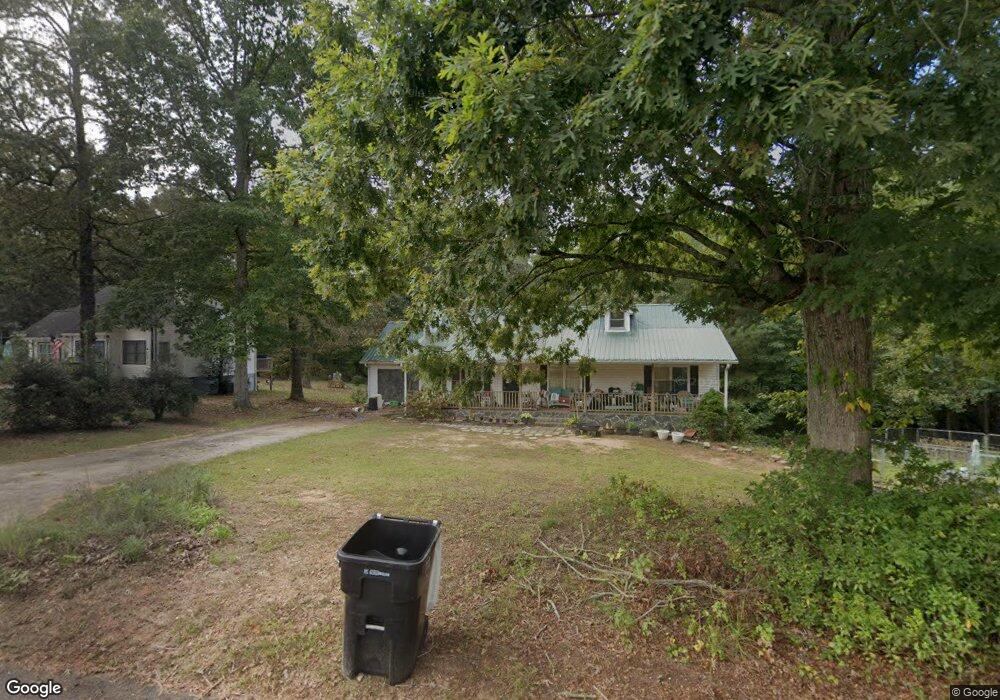
107 Brooke Way Carrollton, GA 30117
Estimated Value: $275,061 - $301,000
3
Beds
2
Baths
1,720
Sq Ft
$168/Sq Ft
Est. Value
About This Home
This home is located at 107 Brooke Way, Carrollton, GA 30117 and is currently estimated at $289,515, approximately $168 per square foot. 107 Brooke Way is a home located in Carroll County with nearby schools including Mt. Zion Elementary School, Mt. Zion Middle School, and Mt. Zion High School.
Ownership History
Date
Name
Owned For
Owner Type
Purchase Details
Closed on
Dec 20, 2017
Sold by
Haberkam Michael Allen
Bought by
Haberkam Carol
Current Estimated Value
Purchase Details
Closed on
Nov 17, 2006
Sold by
Ayler Chris D
Bought by
Ruddock Marietta M
Home Financials for this Owner
Home Financials are based on the most recent Mortgage that was taken out on this home.
Original Mortgage
$135,000
Interest Rate
6.36%
Mortgage Type
New Conventional
Purchase Details
Closed on
Jun 22, 2004
Sold by
Spann Teresa and Spann Derek
Bought by
Ruddock Marietta M
Purchase Details
Closed on
Oct 13, 2000
Sold by
Spann Shirley
Bought by
Spann Teresa
Purchase Details
Closed on
Apr 14, 1998
Sold by
Spann Derek L and Spann Tere
Bought by
Spann Derek L and Spann Shir
Purchase Details
Closed on
Mar 13, 1997
Sold by
Spann Derek L
Bought by
Spann Derek L and Spann Tere
Create a Home Valuation Report for This Property
The Home Valuation Report is an in-depth analysis detailing your home's value as well as a comparison with similar homes in the area
Home Values in the Area
Average Home Value in this Area
Purchase History
| Date | Buyer | Sale Price | Title Company |
|---|---|---|---|
| Haberkam Carol | -- | -- | |
| Ruddock Marietta M | -- | -- | |
| Ruddock Marietta M | $131,000 | -- | |
| Spann Teresa | -- | -- | |
| Spann Derek L | -- | -- | |
| Spann Derek L | -- | -- | |
| Spann Derek L | $93,300 | -- |
Source: Public Records
Mortgage History
| Date | Status | Borrower | Loan Amount |
|---|---|---|---|
| Previous Owner | Ruddock Marietta M | $135,000 |
Source: Public Records
Tax History Compared to Growth
Tax History
| Year | Tax Paid | Tax Assessment Tax Assessment Total Assessment is a certain percentage of the fair market value that is determined by local assessors to be the total taxable value of land and additions on the property. | Land | Improvement |
|---|---|---|---|---|
| 2024 | $2,440 | $98,318 | $7,000 | $91,318 |
| 2023 | $2,440 | $89,938 | $7,000 | $82,938 |
| 2022 | $2,063 | $73,583 | $7,000 | $66,583 |
| 2021 | $1,860 | $63,976 | $7,000 | $56,976 |
| 2020 | $1,291 | $57,343 | $7,000 | $50,343 |
| 2019 | $1,229 | $53,418 | $7,000 | $46,418 |
| 2018 | $1,131 | $47,089 | $7,000 | $40,089 |
| 2017 | $1,085 | $47,089 | $7,000 | $40,089 |
| 2016 | $1,085 | $47,089 | $7,000 | $40,089 |
| 2015 | $1,037 | $41,076 | $4,000 | $37,076 |
| 2014 | $1,041 | $41,076 | $4,000 | $37,076 |
Source: Public Records
Map
Nearby Homes
- 174 Katie Ln
- 68 Tyler Ln
- 142 Tyler Ln
- 898 Bowdon Junction Rd
- 14 Cole Lake Rd
- 469 Lee Williams Rd
- 676 Hog Liver Rd
- 112 Turkey Creek Trail
- The Thomas 2 Plan at Lambert Overlook
- The Thomas Plan at Lambert Overlook
- The Brook Plan at Lambert Overlook
- 266 Lambert Overlook Cir
- 405 Adler Point
- 313 Lucy Ln
- 00 Hog Liver Rd Unit 346
- 0 Hog Liver Rd Unit 148331
- 0 Hog Liver Rd Unit 10630257
- 0 Hog Liver Rd Unit 7671087
- 0 Hog Liver Rd Unit 10614601
- 0 Hog Liver Rd Unit 10630818
- 127 Brooke Way
- 85 Brooke Way
- 129 Brooke Way
- 118 Brooke Way
- 94 Brooke Way
- 140 Brooke Way
- 84 Brooke Way
- 0 Brooke Way
- 130 Brooke Way
- 164 Katie Ln
- 104 Brooke Way
- 150 Brooke Way
- 142 Katie Ln Unit 16
- 142 Katie Ln
- 154 Katie Ln
- 305 Katie Ln
- 0 Katie Ln Unit 8618329
- 0 Katie Ln Unit 7065573
- 0 Katie Ln Unit 9068648
- 0 Katie Ln Unit 8333046