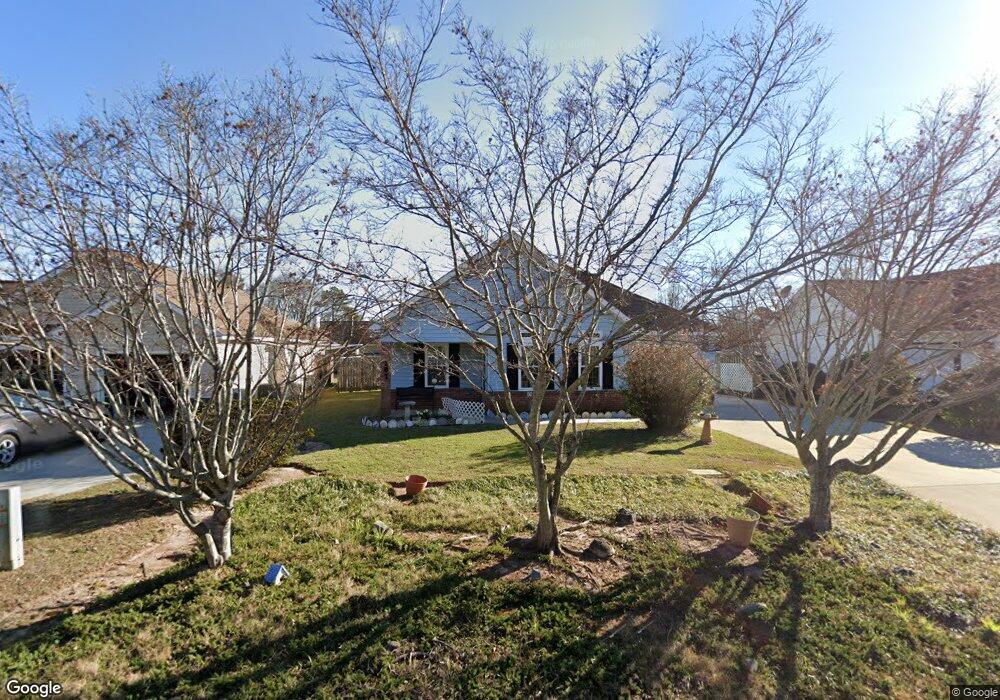
107 Camelot Place Warner Robins, GA 31093
Estimated Value: $166,000 - $189,000
2
Beds
2
Baths
1,025
Sq Ft
$174/Sq Ft
Est. Value
About This Home
This home is located at 107 Camelot Place, Warner Robins, GA 31093 and is currently estimated at $178,006, approximately $173 per square foot. 107 Camelot Place is a home located in Houston County with nearby schools including Parkwood Elementary School, Northside Middle School, and Northside High School.
Ownership History
Date
Name
Owned For
Owner Type
Purchase Details
Closed on
Jun 25, 2013
Sold by
Anderson Jo-Ann A
Bought by
Anderson Jo-Ann A and Ellis Steven C*
Current Estimated Value
Purchase Details
Closed on
Jul 18, 2007
Sold by
Ellis Steven C
Bought by
Anderson Jo Ann A
Purchase Details
Closed on
Jul 19, 2006
Sold by
Ellis Steven C and Anderson Jo Ann A
Bought by
Anderson Jo Ann A and Ellis Steven C
Purchase Details
Closed on
Jan 14, 2004
Sold by
Anderson Joann A
Bought by
Ellis Steven C and Anderson Jo Ann A
Purchase Details
Closed on
Nov 20, 2002
Sold by
Anderson Robert J
Bought by
Anderson Joann A
Purchase Details
Closed on
Aug 12, 2002
Sold by
Asbell Max
Bought by
Anderson Robert J
Create a Home Valuation Report for This Property
The Home Valuation Report is an in-depth analysis detailing your home's value as well as a comparison with similar homes in the area
Home Values in the Area
Average Home Value in this Area
Purchase History
| Date | Buyer | Sale Price | Title Company |
|---|---|---|---|
| Anderson Jo-Ann A | -- | -- | |
| Anderson Jo Ann A | -- | None Available | |
| Anderson Jo Ann A | -- | None Available | |
| Ellis Steven C | -- | -- | |
| Anderson Joann A | $79,000 | -- | |
| Anderson Robert J | $9,500 | -- |
Source: Public Records
Tax History Compared to Growth
Tax History
| Year | Tax Paid | Tax Assessment Tax Assessment Total Assessment is a certain percentage of the fair market value that is determined by local assessors to be the total taxable value of land and additions on the property. | Land | Improvement |
|---|---|---|---|---|
| 2024 | $1,270 | $52,480 | $8,000 | $44,480 |
| 2023 | $915 | $41,400 | $8,000 | $33,400 |
| 2022 | $605 | $35,440 | $4,800 | $30,640 |
| 2021 | $537 | $32,360 | $4,800 | $27,560 |
| 2020 | $521 | $31,560 | $4,800 | $26,760 |
| 2019 | $521 | $31,560 | $4,800 | $26,760 |
| 2018 | $521 | $31,560 | $4,800 | $26,760 |
| 2017 | $521 | $31,560 | $4,800 | $26,760 |
| 2016 | $410 | $26,760 | $4,800 | $21,960 |
| 2015 | -- | $26,760 | $4,800 | $21,960 |
| 2014 | $78 | $31,840 | $4,800 | $27,040 |
| 2013 | $78 | $31,840 | $4,800 | $27,040 |
Source: Public Records
Map
Nearby Homes
- 118 Avalon Dr
- 107 Galahad Dr
- 112 Emory Dr
- 208 Pellimore Dr
- 857 Ola Dr
- 152 Rock Run Trail
- 131 Martin Mill Trail
- 156 Red Birch Ln
- 110 Foxfire Dr
- 123 Tanglewood Dr
- 317 Emory Dr
- 709 Meadowridge Dr
- 302 Kensington Cir
- 725 B East Side Dr
- 719 Meadowridge Dr
- 305 Norman Ln
- 221 Gilchrist Dr
- 303 Pinecrest Dr
- 316 Meadowridge Dr
- 109 Camelot Place
- 105 Camelot Place
- 103 Camelot Place
- 111 Camelot Place
- 114 Camelot Place
- 112 Camelot Place
- 113 Camelot Place
- 116 Camelot Place
- 101 Camelot Place
- 110 Camelot Place
- 118 Camelot Place
- 115 Camelot Place
- 104 Camelot Place
- 102 Camelot Place
- 108 Camelot Place
- 106 Camelot Place
- 120 Camelot Place
- 100 Camelot Place
- 115 Avalon Dr
- 117 Camelot Place