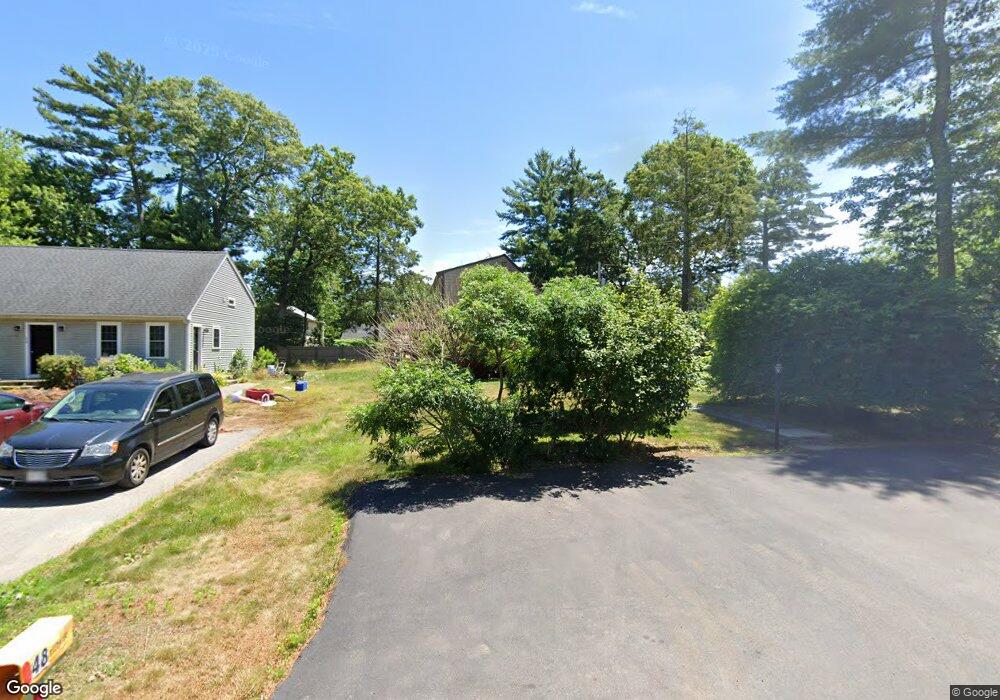
107 Charles St Hanson, MA 02341
Estimated Value: $429,476 - $490,000
3
Beds
1
Bath
1,228
Sq Ft
$366/Sq Ft
Est. Value
About This Home
This home is located at 107 Charles St, Hanson, MA 02341 and is currently estimated at $449,369, approximately $365 per square foot. 107 Charles St is a home located in Plymouth County.
Ownership History
Date
Name
Owned For
Owner Type
Purchase Details
Closed on
Mar 12, 2010
Sold by
Brown Martina A and Hoey Martina A
Bought by
Simpson Courtney M and Blinn Aaron R
Current Estimated Value
Home Financials for this Owner
Home Financials are based on the most recent Mortgage that was taken out on this home.
Original Mortgage
$231,500
Outstanding Balance
$153,740
Interest Rate
5.02%
Mortgage Type
Purchase Money Mortgage
Estimated Equity
$295,629
Purchase Details
Closed on
Jul 19, 2002
Sold by
George Michael P
Bought by
Hoey Martinia A
Purchase Details
Closed on
Sep 30, 1996
Sold by
Williams Louise P Est
Bought by
George Michael P
Create a Home Valuation Report for This Property
The Home Valuation Report is an in-depth analysis detailing your home's value as well as a comparison with similar homes in the area
Home Values in the Area
Average Home Value in this Area
Purchase History
| Date | Buyer | Sale Price | Title Company |
|---|---|---|---|
| Simpson Courtney M | $227,000 | -- | |
| Hoey Martina A | $170,000 | -- | |
| Hoey Martinia A | $170,000 | -- | |
| George Michael P | $97,000 | -- |
Source: Public Records
Mortgage History
| Date | Status | Borrower | Loan Amount |
|---|---|---|---|
| Open | Simpson Courtney M | $231,500 | |
| Previous Owner | George Michael P | $20,000 | |
| Previous Owner | George Michael P | $165,000 |
Source: Public Records
Tax History Compared to Growth
Tax History
| Year | Tax Paid | Tax Assessment Tax Assessment Total Assessment is a certain percentage of the fair market value that is determined by local assessors to be the total taxable value of land and additions on the property. | Land | Improvement |
|---|---|---|---|---|
| 2025 | $4,197 | $313,700 | $143,600 | $170,100 |
| 2024 | $4,076 | $304,600 | $139,400 | $165,200 |
| 2023 | $4,017 | $283,300 | $139,400 | $143,900 |
| 2022 | $3,987 | $264,200 | $126,700 | $137,500 |
| 2021 | $3,198 | $211,800 | $121,900 | $89,900 |
| 2020 | $3,153 | $206,500 | $117,700 | $88,800 |
| 2019 | $2,962 | $190,700 | $108,200 | $82,500 |
| 2018 | $2,930 | $185,100 | $104,100 | $81,000 |
| 2017 | $2,736 | $171,200 | $92,500 | $78,700 |
| 2016 | $2,804 | $169,400 | $92,500 | $76,900 |
| 2015 | $2,730 | $171,500 | $92,500 | $79,000 |
Source: Public Records
Map
Nearby Homes