Estimated Value: $405,000 - $430,000
3
Beds
2
Baths
2,136
Sq Ft
$196/Sq Ft
Est. Value
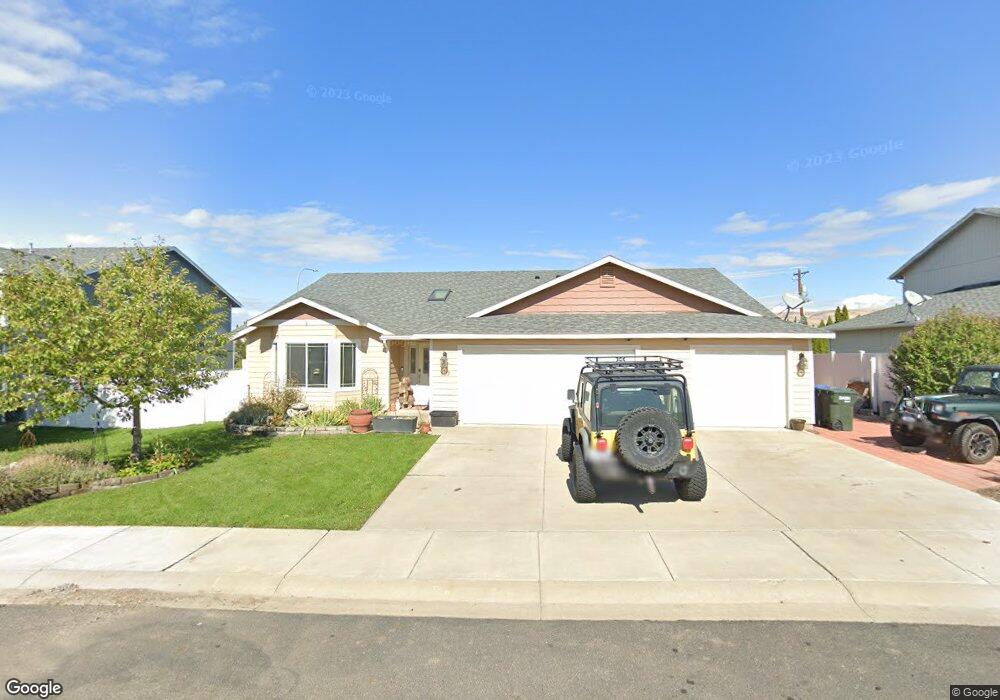
About This Home
This home is located at 107 Clemans Ave, Moxee, WA 98936 and is currently estimated at $418,886, approximately $196 per square foot. 107 Clemans Ave is a home located in Yakima County with nearby schools including East Valley High School.
Ownership History
Date
Name
Owned For
Owner Type
Purchase Details
Closed on
Sep 11, 2018
Sold by
Hakkey Charles W and Hakkey Yvonne L
Bought by
Knight Dennis G and Knight Allyson
Current Estimated Value
Home Financials for this Owner
Home Financials are based on the most recent Mortgage that was taken out on this home.
Original Mortgage
$252,000
Outstanding Balance
$219,779
Interest Rate
4.6%
Mortgage Type
VA
Estimated Equity
$199,107
Purchase Details
Closed on
Jan 15, 2009
Sold by
Nopp Roger V and Nopp Shirley A
Bought by
Aho Construction I Inc
Purchase Details
Closed on
Apr 30, 2008
Sold by
Nopp Roger V and Nopp Shirley A
Bought by
Aho Construction I Inc
Purchase Details
Closed on
Oct 30, 2007
Sold by
Aho Construction I Inc
Bought by
Halley Charles W and Halley Yvonne L
Home Financials for this Owner
Home Financials are based on the most recent Mortgage that was taken out on this home.
Original Mortgage
$144,740
Interest Rate
6.29%
Mortgage Type
Purchase Money Mortgage
Create a Home Valuation Report for This Property
The Home Valuation Report is an in-depth analysis detailing your home's value as well as a comparison with similar homes in the area
Home Values in the Area
Average Home Value in this Area
Purchase History
| Date | Buyer | Sale Price | Title Company |
|---|---|---|---|
| Knight Dennis G | $259,000 | Valley Title Guarantee | |
| Aho Construction I Inc | -- | Pacific Alliance Title Co | |
| Aho Construction I Inc | -- | Pacific Alliance Title Co | |
| Halley Charles W | $180,930 | Pacific Alliance Title Co |
Source: Public Records
Mortgage History
| Date | Status | Borrower | Loan Amount |
|---|---|---|---|
| Open | Knight Dennis G | $252,000 | |
| Previous Owner | Halley Charles W | $144,740 |
Source: Public Records
Tax History
| Year | Tax Paid | Tax Assessment Tax Assessment Total Assessment is a certain percentage of the fair market value that is determined by local assessors to be the total taxable value of land and additions on the property. | Land | Improvement |
|---|---|---|---|---|
| 2025 | $4,181 | $407,600 | $61,100 | $346,500 |
| 2023 | $4,257 | $348,400 | $34,800 | $313,600 |
| 2022 | $3,930 | $316,300 | $34,800 | $281,500 |
| 2021 | $3,629 | $269,500 | $34,800 | $234,700 |
| 2019 | $3,145 | $236,700 | $34,800 | $201,900 |
| 2018 | $2,972 | $208,500 | $34,800 | $173,700 |
| 2017 | $2,521 | $185,600 | $34,800 | $150,800 |
| 2016 | $2,526 | $183,550 | $34,850 | $148,700 |
| 2015 | $2,526 | $183,550 | $34,850 | $148,700 |
| 2014 | $2,526 | $183,550 | $34,850 | $148,700 |
| 2013 | $2,526 | $183,550 | $34,850 | $148,700 |
Source: Public Records
Map
Nearby Homes
- 204 Clemans Ave
- 8711 Postma Rd
- 519 Lacoursiere St
- 7800 Postma Rd
- NKA Rivard Rd
- 505 Faucher Rd
- 104 Bravo St
- 107 Palisade St
- 514 Cascade Ave
- NKA High Point Landing
- 461 White Rd
- 2206 Porter Loop
- NKA E Norman Rd
- NKA Birchfield Rd
- 1291 E Norman Rd
- 312 Wendt Rd
- 230 S Clark Heights Rd
- 720 Country Club Dr
- 150 Solar Ln
- 6402 Horizons Ct
- 201 Clemans Ave
- 105 Clemans Ave
- 203 Clemans Ave
- 108 Clemans Ave
- 106 Clemans Ave
- 103 Clemans Ave
- 202 Clemans Ave
- 104 Clemans Ave
- 101 Clemans Ave
- 205 Clemans Ave
- 102 Clemans Ave
- 107 Darland Ave
- 105 Darland Ave
- 103 Darland Ave
- 206 Clemans Ave
- 616 Mount Adams St
- NNA Postma Duffield Rd
- 614 Mount Adams St
- 203 Darland Ave
Your Personal Tour Guide
Ask me questions while you tour the home.