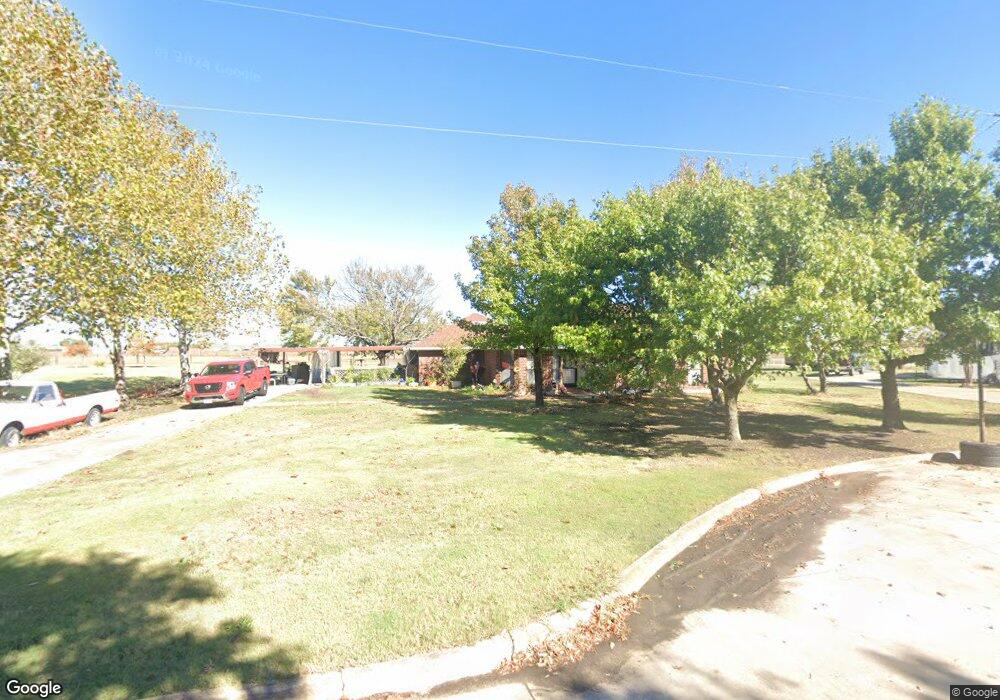
107 County Road 1010 Princeton, TX 75407
Estimated Value: $253,604 - $393,000
3
Beds
2
Baths
1,238
Sq Ft
$250/Sq Ft
Est. Value
About This Home
This home is located at 107 County Road 1010, Princeton, TX 75407 and is currently estimated at $309,401, approximately $249 per square foot. 107 County Road 1010 is a home located in Collin County with nearby schools including Princeton High School.
Ownership History
Date
Name
Owned For
Owner Type
Purchase Details
Closed on
Dec 4, 2001
Sold by
Martin Chad Wesley
Bought by
Avila Melinda and Avila Gabriel
Current Estimated Value
Home Financials for this Owner
Home Financials are based on the most recent Mortgage that was taken out on this home.
Original Mortgage
$105,306
Outstanding Balance
$41,210
Interest Rate
6.59%
Mortgage Type
FHA
Estimated Equity
$268,191
Purchase Details
Closed on
Jun 20, 2001
Sold by
Martin Regina Lynn
Bought by
Martin Chad Wesley
Home Financials for this Owner
Home Financials are based on the most recent Mortgage that was taken out on this home.
Original Mortgage
$85,405
Interest Rate
7.08%
Mortgage Type
Seller Take Back
Purchase Details
Closed on
Sep 25, 1997
Sold by
Mathers Ann E and Webster Samuel W
Bought by
Martin Chad W and Martin Regina L
Home Financials for this Owner
Home Financials are based on the most recent Mortgage that was taken out on this home.
Original Mortgage
$85,400
Interest Rate
7.49%
Create a Home Valuation Report for This Property
The Home Valuation Report is an in-depth analysis detailing your home's value as well as a comparison with similar homes in the area
Home Values in the Area
Average Home Value in this Area
Purchase History
| Date | Buyer | Sale Price | Title Company |
|---|---|---|---|
| Avila Melinda | -- | -- | |
| Martin Chad Wesley | -- | -- | |
| Martin Chad Wesley | -- | -- | |
| Martin Chad W | -- | -- |
Source: Public Records
Mortgage History
| Date | Status | Borrower | Loan Amount |
|---|---|---|---|
| Open | Avila Melinda | $105,306 | |
| Previous Owner | Martin Chad Wesley | $85,405 | |
| Previous Owner | Martin Chad W | $85,400 | |
| Closed | Martin Chad Wesley | $0 |
Source: Public Records
Tax History Compared to Growth
Tax History
| Year | Tax Paid | Tax Assessment Tax Assessment Total Assessment is a certain percentage of the fair market value that is determined by local assessors to be the total taxable value of land and additions on the property. | Land | Improvement |
|---|---|---|---|---|
| 2025 | $2,252 | $264,853 | $115,000 | $208,314 |
| 2024 | $2,252 | $240,775 | $115,000 | $181,218 |
| 2023 | $2,252 | $218,886 | $115,000 | $163,475 |
| 2022 | $3,336 | $198,987 | $70,000 | $141,957 |
| 2021 | $3,093 | $180,897 | $50,000 | $130,897 |
| 2020 | $3,339 | $183,029 | $50,000 | $133,029 |
| 2019 | $3,230 | $171,625 | $35,000 | $136,625 |
| 2018 | $3,270 | $172,843 | $35,000 | $140,830 |
| 2017 | $2,973 | $163,411 | $30,000 | $133,411 |
| 2016 | $2,728 | $142,845 | $30,000 | $112,845 |
| 2015 | $2,094 | $133,890 | $30,000 | $103,890 |
Source: Public Records
Map
Nearby Homes
- 7011 Moonflower Ln
- 312 Tall Cedar Way
- 7007 Moonflower Ln
- 318 Tall Cedar Way
- 6635 Coulter Dr
- 115 Herman Ln
- 120 Creek End Dr
- 404 Creek End Dr
- 315 Tall Cedar Way
- 406 Tall Cedar Way
- 7014 Cottonseed Dr
- 7015 Cottonseed Dr
- Cibola Plan at Tillage Farms - Wellton Haven
- Kitson Plan at Tillage Farms - Cottage West
- Woodhaven Plan at Tillage Farms - Cottage West
- Beckman Plan at Tillage Farms - Watermill West
- Cibola Plan at Tillage Farms - Wellton South
- Newlin Plan at Tillage Farms - Watermill West
- Pima Plan at Tillage Farms - Wellton South
- Clearwater Plan at Tillage Farms - Coastline
- 109 County Road 1010
- 105 County Road 1010
- 108 County Road 1010
- 111 County Road 1010
- 103 County Road 1010
- 202 County Road 1010
- 7097 Fm 982
- 203 County Road 1010
- 104 County Road 1010
- 101 County Road 1010
- 204 County Road 1010
- 205 County Road 1010
- 206 County Road 1010
- 102 County Road 1010
- 102 County Road 1010
- 7067 Fm 982
- 7259 Farm To Market 982
- 7259 Fm 982
- 207 County Road 1010
- 7259 Fm982