107 Dawn Ln Unit T418 Waverly, OH 45690
Estimated Value: $107,000 - $164,000
3
Beds
1
Bath
912
Sq Ft
$153/Sq Ft
Est. Value
About This Home
This home is located at 107 Dawn Ln Unit T418, Waverly, OH 45690 and is currently estimated at $139,519, approximately $152 per square foot. 107 Dawn Ln Unit T418 is a home located in Pike County with nearby schools including Waverly Primary School, Waverly Intermediate School, and Waverly Junior High School.
Ownership History
Date
Name
Owned For
Owner Type
Purchase Details
Closed on
Jun 28, 2024
Sold by
Pietschman William Robert and Pietschman Marita
Bought by
Pratt Dorsey L and Pratt Terri A
Current Estimated Value
Home Financials for this Owner
Home Financials are based on the most recent Mortgage that was taken out on this home.
Original Mortgage
$50,500
Outstanding Balance
$49,869
Interest Rate
6.75%
Mortgage Type
New Conventional
Estimated Equity
$89,650
Purchase Details
Closed on
Mar 5, 2019
Sold by
Zimmerman Anita and Zimmerman Larry
Bought by
Pietschman William Robert
Purchase Details
Closed on
Apr 12, 2018
Sold by
Brigner Mathew and Brigner Kasey
Bought by
Taylor Patty and Zimmerman Larry
Purchase Details
Closed on
Mar 13, 2018
Sold by
Brigner Nancy Ann
Bought by
Brigner Mathew and Gampp Brittany Brigner
Purchase Details
Closed on
Aug 4, 2016
Sold by
Zimmerman Michael Orlie and Zimmerman Amber Michael
Bought by
Zimmerman Randall W and Taylor Patti
Create a Home Valuation Report for This Property
The Home Valuation Report is an in-depth analysis detailing your home's value as well as a comparison with similar homes in the area
Home Values in the Area
Average Home Value in this Area
Purchase History
| Date | Buyer | Sale Price | Title Company |
|---|---|---|---|
| Pratt Dorsey L | $100,000 | None Listed On Document | |
| Pratt Dorsey L | $100,000 | None Listed On Document | |
| Pietschman William Robert | $60,000 | None Available | |
| Taylor Patty | -- | None Available | |
| Brigner Mathew | -- | None Available | |
| Zimmerman Randall W | -- | None Available |
Source: Public Records
Mortgage History
| Date | Status | Borrower | Loan Amount |
|---|---|---|---|
| Open | Pratt Dorsey L | $50,500 | |
| Closed | Pratt Dorsey L | $50,500 |
Source: Public Records
Tax History Compared to Growth
Tax History
| Year | Tax Paid | Tax Assessment Tax Assessment Total Assessment is a certain percentage of the fair market value that is determined by local assessors to be the total taxable value of land and additions on the property. | Land | Improvement |
|---|---|---|---|---|
| 2024 | $1,279 | $38,900 | $8,330 | $30,570 |
| 2023 | $1,279 | $38,900 | $8,330 | $30,570 |
| 2022 | $1,775 | $24,770 | $7,330 | $17,440 |
| 2021 | $1,514 | $24,770 | $7,330 | $17,440 |
| 2020 | $1,233 | $24,770 | $7,330 | $17,440 |
| 2019 | $483 | $21,900 | $6,430 | $15,470 |
| 2018 | $563 | $21,900 | $6,430 | $15,470 |
| 2017 | $636 | $26,290 | $6,430 | $19,860 |
| 2016 | $682 | $18,160 | $2,780 | $15,380 |
| 2015 | $353 | $18,160 | $2,780 | $15,380 |
| 2014 | $341 | $18,160 | $2,780 | $15,380 |
| 2013 | $346 | $18,160 | $2,780 | $15,380 |
| 2012 | $355 | $18,160 | $2,780 | $15,380 |
Source: Public Records
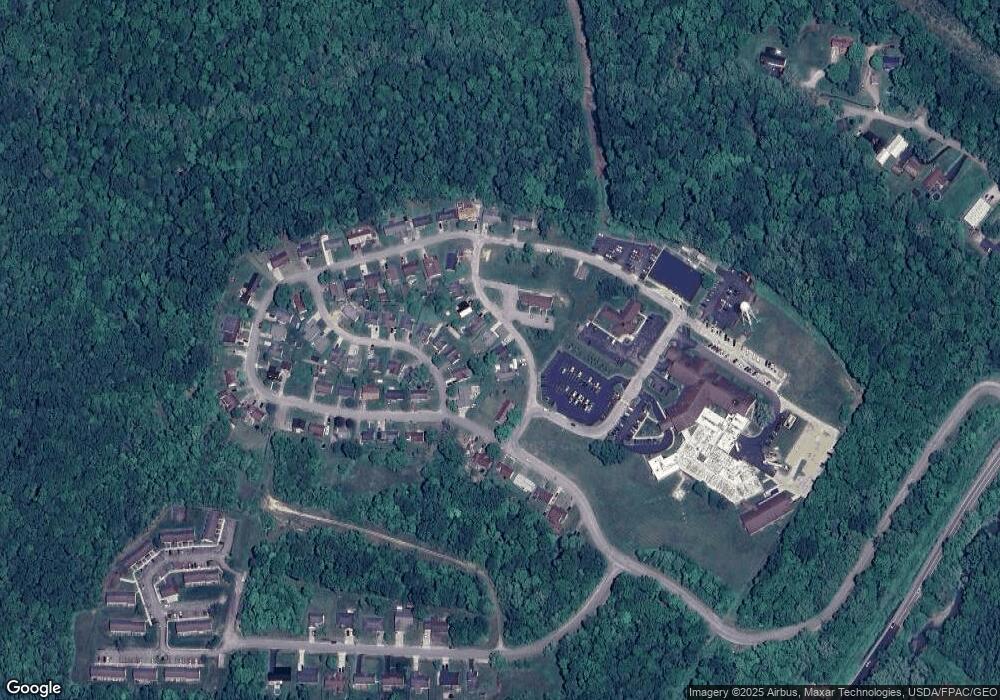
Map
Nearby Homes
- 109 Waverly Gables Blvd
- 132 Pinehurst Blvd
- 101 Pinehurst Blvd
- 650 E 2nd St
- 116 Overlook Dr
- 414 W Emmitt Ave
- 0 Rd Unit 198381
- 90 Taylor Rd
- 0 Ohio 552
- 644 Ohio 552
- 219 Grandview Ave
- 192 Victory Dr
- 300 W Emmitt Ave
- 6460 Ohio 220
- 0 U S 23
- 300 W 5th St
- 2237 Ohio 220
- 304 W 5th St
- 120 S Lock St
- 237 Songbird Ln
- 109 Dawn Ln Unit T418
- 105 Dawn Ln Unit T418
- 111 Dawn Ln Unit T418
- 102 Sunrise Ln Unit T480
- 104 Sunrise Ln Unit T480
- 100 Sunrise Ln Unit T480
- 113 Dawn Ln Unit T418
- 101 Dawn Ln
- 108 Sunrise Ln Unit T480
- 115 Dawn Ln Unit T418
- 116 Waverly Gables Blvd Unit T478
- 103 Sunrise Ln Unit T480
- 110 Sunrise Ln Unit T480
- 105 Sunrise Ln Unit T480
- 134 Valley View Dr Unit T479
- 111 Waverly Gables Rd
- 118 Waverly Gables Rd
- 132 Valley View Dr Unit T479
- 112 Sunrise Ln Unit T480
- 117 Waverly Gables Blvd