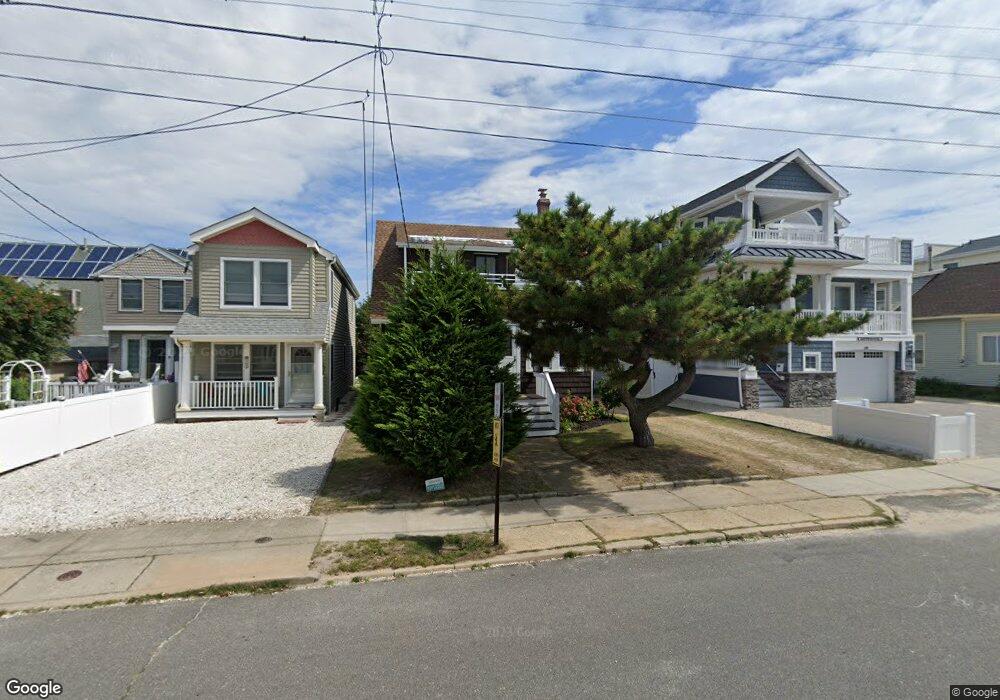
107 E 20th St Ship Bottom, NJ 08008
Long Beach Island NeighborhoodEstimated Value: $1,981,000 - $2,095,714
4
Beds
3
Baths
2,122
Sq Ft
$955/Sq Ft
Est. Value
About This Home
This home is located at 107 E 20th St, Ship Bottom, NJ 08008 and is currently estimated at $2,026,905, approximately $955 per square foot. 107 E 20th St is a home located in Ocean County with nearby schools including Ethel A. Jacobsen Elementary School, Long Beach Island Grade School, and Southern Regional Middle School.
Ownership History
Date
Name
Owned For
Owner Type
Purchase Details
Closed on
May 20, 2021
Sold by
Ravalico Bruno P and Eble Julia E
Bought by
Chessin David and Mcweeney Michelle
Current Estimated Value
Home Financials for this Owner
Home Financials are based on the most recent Mortgage that was taken out on this home.
Original Mortgage
$999,000
Outstanding Balance
$903,928
Interest Rate
3%
Mortgage Type
New Conventional
Estimated Equity
$1,122,977
Purchase Details
Closed on
Jan 16, 2004
Sold by
Ehj Inc
Bought by
Ravalico Bruno P and Elbe Julia E
Create a Home Valuation Report for This Property
The Home Valuation Report is an in-depth analysis detailing your home's value as well as a comparison with similar homes in the area
Home Values in the Area
Average Home Value in this Area
Purchase History
| Date | Buyer | Sale Price | Title Company |
|---|---|---|---|
| Chessin David | $1,350,000 | Chicago Title Insurance Co | |
| Ravalico Bruno P | $793,000 | -- | |
| -- | $793,000 | -- |
Source: Public Records
Mortgage History
| Date | Status | Borrower | Loan Amount |
|---|---|---|---|
| Open | Chessin David | $999,000 |
Source: Public Records
Tax History
| Year | Tax Paid | Tax Assessment Tax Assessment Total Assessment is a certain percentage of the fair market value that is determined by local assessors to be the total taxable value of land and additions on the property. | Land | Improvement |
|---|---|---|---|---|
| 2025 | $9,751 | $1,091,900 | $513,000 | $578,900 |
| 2024 | $9,685 | $1,091,900 | $513,000 | $578,900 |
Source: Public Records
Map
Nearby Homes
- 1219 Long Beach Blvd
- 1810 Central Ave Unit 17
- 111 W 18th St Unit 2
- 108 W 22nd St
- 106 W 26th St
- 213 W 13th St
- 1001 Ocean Ave Unit C1001
- 354 W 11th St
- 10 E 34th St
- 6 E 35th St
- 615 S Barnegat Ave
- 3608B Long Beach Blvd
- 401 Boulevard Unit 306
- 401 Boulevard Unit 203
- 401 Boulevard Unit 503
- 401 Boulevard Unit 205
- 401 Boulevard Unit 202
- 401 Boulevard Unit 206
- 401 Boulevard Unit 204
- 3700 W 38th St
Your Personal Tour Guide
Ask me questions while you tour the home.