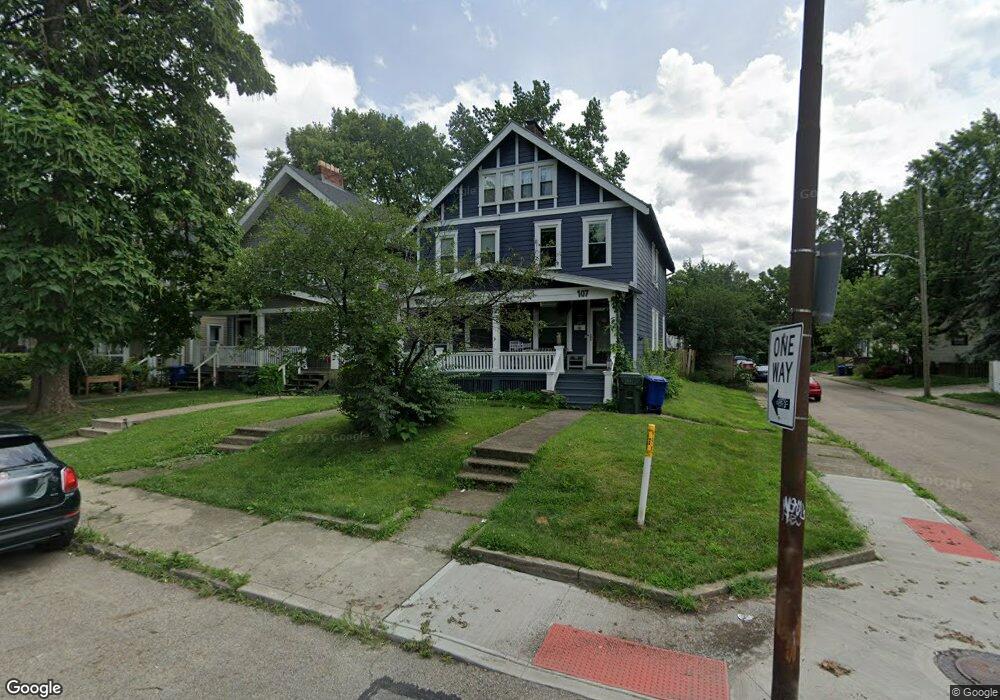
107 E Blake Ave Unit 109 Columbus, OH 43202
Old North Columbus NeighborhoodEstimated Value: $458,843 - $566,000
5
Beds
2
Baths
3,093
Sq Ft
$160/Sq Ft
Est. Value
About This Home
This home is located at 107 E Blake Ave Unit 109, Columbus, OH 43202 and is currently estimated at $493,711, approximately $159 per square foot. 107 E Blake Ave Unit 109 is a home located in Franklin County with nearby schools including Hubbard Elementary School, Dominion Middle School, and Whetstone High School.
Ownership History
Date
Name
Owned For
Owner Type
Purchase Details
Closed on
Mar 12, 2019
Sold by
Remington Styer Michael and Remington Lyman
Bought by
Very Good Homes Llc
Current Estimated Value
Purchase Details
Closed on
Oct 31, 2017
Sold by
Casto David A
Bought by
Lyman Remington and Styer Michael
Home Financials for this Owner
Home Financials are based on the most recent Mortgage that was taken out on this home.
Original Mortgage
$317,000
Interest Rate
3.83%
Mortgage Type
New Conventional
Purchase Details
Closed on
Jul 10, 1997
Sold by
Vanstavarn Thomas A
Bought by
Casto David A
Home Financials for this Owner
Home Financials are based on the most recent Mortgage that was taken out on this home.
Original Mortgage
$73,364
Interest Rate
8%
Mortgage Type
FHA
Purchase Details
Closed on
Apr 13, 1990
Purchase Details
Closed on
Sep 7, 1988
Create a Home Valuation Report for This Property
The Home Valuation Report is an in-depth analysis detailing your home's value as well as a comparison with similar homes in the area
Home Values in the Area
Average Home Value in this Area
Purchase History
| Date | Buyer | Sale Price | Title Company |
|---|---|---|---|
| Very Good Homes Llc | -- | Stewart Title Box | |
| Lyman Remington | $338,000 | Independent Title Svcs Inc B | |
| Casto David A | $73,500 | -- | |
| -- | $63,000 | -- | |
| -- | $56,000 | -- |
Source: Public Records
Mortgage History
| Date | Status | Borrower | Loan Amount |
|---|---|---|---|
| Previous Owner | Lyman Remington | $317,000 | |
| Previous Owner | Casto David A | $73,364 |
Source: Public Records
Tax History
| Year | Tax Paid | Tax Assessment Tax Assessment Total Assessment is a certain percentage of the fair market value that is determined by local assessors to be the total taxable value of land and additions on the property. | Land | Improvement |
|---|---|---|---|---|
| 2025 | $6,750 | $147,290 | $27,970 | $119,320 |
| 2024 | $6,750 | $147,290 | $27,970 | $119,320 |
| 2023 | $6,816 | $147,280 | $27,965 | $119,315 |
| 2022 | $6,976 | $131,260 | $16,770 | $114,490 |
| 2021 | $6,988 | $131,260 | $16,770 | $114,490 |
| 2020 | $6,998 | $131,260 | $16,770 | $114,490 |
| 2019 | $6,530 | $105,010 | $13,410 | $91,600 |
| 2018 | $5,026 | $105,010 | $13,410 | $91,600 |
| 2017 | $4,836 | $78,760 | $13,410 | $65,350 |
| 2016 | $3,976 | $59,260 | $8,330 | $50,930 |
| 2015 | $3,433 | $59,260 | $8,330 | $50,930 |
| 2014 | $3,623 | $59,260 | $8,330 | $50,930 |
| 2013 | $1,626 | $53,900 | $7,595 | $46,305 |
Source: Public Records
Map
Nearby Homes
- 23 E Maynard Ave
- 6 E Blake Ave
- 210 E Blake Ave
- 68 E Oakland Ave
- 2458- 2458 1 2 Deming Ave
- 2343 Indianola Ave
- 2478-2480 Deming Ave
- 2394 Neil Ave
- 2470 Indianola Ave
- 2540 Neil Ave
- 9 E Norwich Ave Unit 15
- 2362 Indiana Ave
- 2395 Summit St Unit 397
- 74 E Dodridge St
- 109 E Arcadia Ave
- 2717 Hibbert Ave
- 2683 Neil Ave Unit 685
- 2295 N 4th St
- 2555 Glenmawr Ave
- 415 Glen Echo Cir
- 107 E Blake Ave Unit 9
- 111 E Blake Ave Unit 113
- 2406-2408 Findley Ave
- 2406 Findley Ave Unit 408
- 115 E Blake Ave Unit 117
- 115-117 E Blake Ave
- 97 E Blake Ave
- 2400 Findley Ave Unit 402
- 2400 Findley Ave
- 2400-2402 Findley Ave
- 2403 Findley Ave
- 93 E Blake Ave
- 110 E Blake Ave
- 120 E Blake Ave
- 114 E Blake Ave Unit 116
- 127 E Blake Ave
- 2396 Findley Ave
- 85 E Blake Ave
- 98 E Blake Ave
- 124-126 E Blake Ave
Your Personal Tour Guide
Ask me questions while you tour the home.