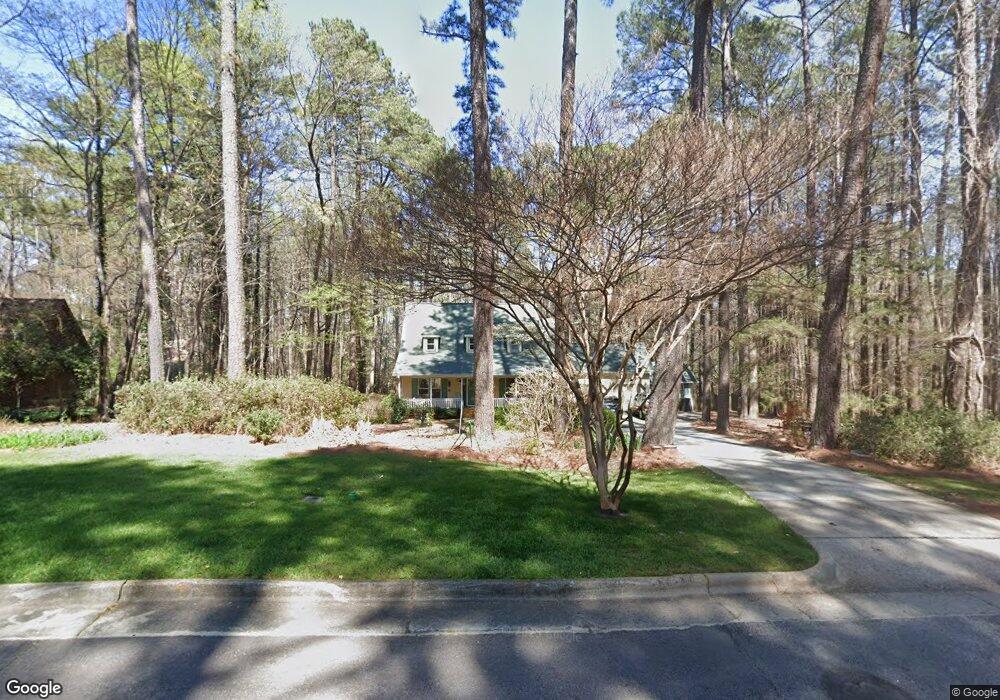
107 E Green Forest Dr Cary, NC 27518
Middle Creek NeighborhoodEstimated Value: $850,834 - $998,000
Studio
--
Bath
2,994
Sq Ft
$303/Sq Ft
Est. Value
About This Home
This home is located at 107 E Green Forest Dr, Cary, NC 27518 and is currently estimated at $908,459, approximately $303 per square foot. 107 E Green Forest Dr is a home located in Wake County with nearby schools including Dillard Drive Magnet Elementary School, Dillard Drive Magnet Middle School, and TMSA Triangle - Triangle Math and Science Academy.
Ownership History
Date
Name
Owned For
Owner Type
Purchase Details
Closed on
Oct 6, 2020
Sold by
Dumas Robert D and Dumas Vickie I
Bought by
Dumas Robert D and Dumas Vickie I
Current Estimated Value
Purchase Details
Closed on
Jun 1, 2001
Sold by
Bissett Colin J
Bought by
Dumas Robert D and Dumas Vickie I
Home Financials for this Owner
Home Financials are based on the most recent Mortgage that was taken out on this home.
Original Mortgage
$228,000
Interest Rate
7.11%
Purchase Details
Closed on
Aug 14, 1998
Sold by
Havel Jerome E
Bought by
Bissett Colin J and Bissett George Ann
Home Financials for this Owner
Home Financials are based on the most recent Mortgage that was taken out on this home.
Original Mortgage
$175,000
Interest Rate
6.97%
Create a Home Valuation Report for This Property
The Home Valuation Report is an in-depth analysis detailing your home's value as well as a comparison with similar homes in the area
Home Values in the Area
Average Home Value in this Area
Purchase History
| Date | Buyer | Sale Price | Title Company |
|---|---|---|---|
| Dumas Robert D | -- | None Available | |
| Dumas Family Trust | -- | None Listed On Document | |
| Dumas Robert D | $285,000 | -- | |
| Bissett Colin J | $258,000 | -- |
Source: Public Records
Mortgage History
| Date | Status | Borrower | Loan Amount |
|---|---|---|---|
| Previous Owner | Dumas Robert D | $228,000 | |
| Previous Owner | Bissett Colin J | $175,000 | |
| Closed | Dumas Robert D | $28,500 |
Source: Public Records
Tax History
| Year | Tax Paid | Tax Assessment Tax Assessment Total Assessment is a certain percentage of the fair market value that is determined by local assessors to be the total taxable value of land and additions on the property. | Land | Improvement |
|---|---|---|---|---|
| 2025 | $6,843 | $796,022 | $280,000 | $516,022 |
| 2024 | $6,695 | $796,022 | $280,000 | $516,022 |
Source: Public Records
Map
Nearby Homes
- 101 Springbrook Place
- 105 Duckhead Point
- 105 Headlands Ln
- 107 Larkwood Ln
- 101 Loch Haven Ln
- 0 SE Cary Pkwy Unit 2491180
- 6315 Tryon Rd
- 301 Glen Echo Ln Unit E
- 528 Spring Flower Ct
- 516 Spring Flower Ct
- 512 Spring Flower Ct
- 300 W Kirkfield Dr
- 124 Chattel Close
- 103 Lochberry Ln
- 104 Ayelsford Dr
- 406 Cricketfield Ln
- 103 Springberry Ct
- 1641 Kildonan Place
- 124 Rosewall Ln
- 117 Crilly Ln
- 109 E Green Forest Dr
- 105 E Green Forest Dr
- 104 E Green Forest Dr
- 101 Winterbrook Ct
- 103 Winterbrook Ct
- 106 E Green Forest Dr
- 103 E Green Forest Dr
- 201 Summerwinds Dr
- 203 Summerwinds Dr
- 202 E Green Forest Dr
- 105 Winterbrook Ct
- 201 E Green Forest Dr
- 6713 Tryon Rd
- 105 Summerwinds Dr
- 205 Summerwinds Dr
- 6655 Tryon Rd
- 104 Autumn Cir
- 204 E Green Forest Dr
- 104 Winterbrook Ct
- 200 Summerwinds Dr
Your Personal Tour Guide
Ask me questions while you tour the home.