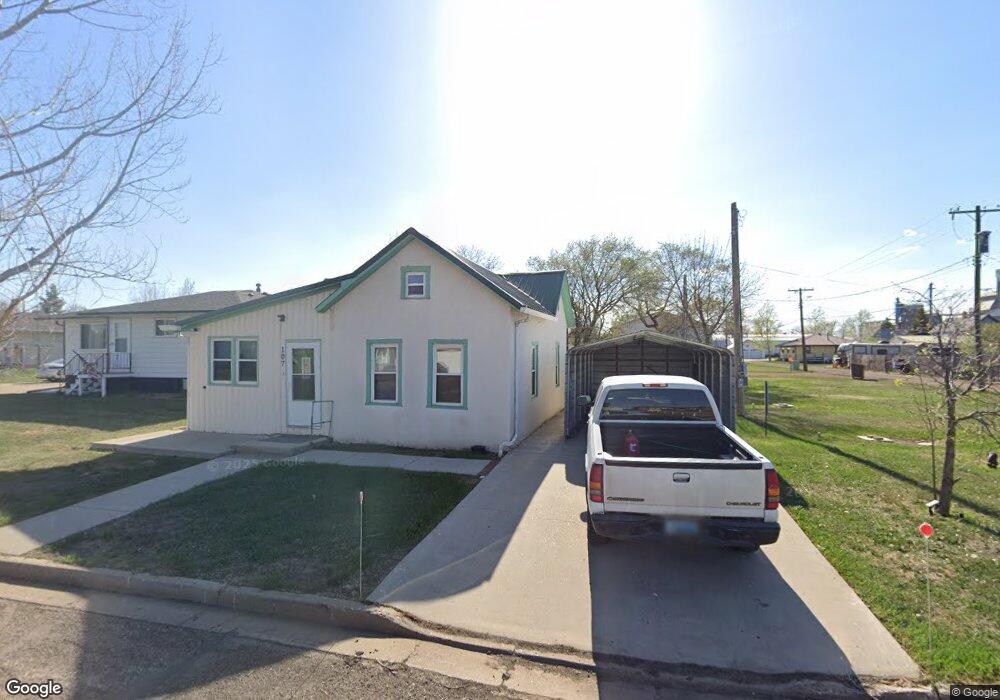
107 E St S Glen Ullin, ND 58631
Estimated Value: $111,998 - $151,000
1
Bed
1
Bath
984
Sq Ft
$127/Sq Ft
Est. Value
About This Home
This home is located at 107 E St S, Glen Ullin, ND 58631 and is currently estimated at $124,750, approximately $126 per square foot. 107 E St S is a home located in Morton County with nearby schools including Glen Ullin Elementary School and Glen Ullin High School.
Ownership History
Date
Name
Owned For
Owner Type
Purchase Details
Closed on
Jan 7, 2026
Sold by
Beaumont Ross Colby Wayne and Beaumont Eric Ross
Bought by
Gumhp Llc
Current Estimated Value
Purchase Details
Closed on
Feb 27, 2025
Sold by
Johnson Robert R and Johnson Patricia A
Bought by
Ross Colby Beaumont
Purchase Details
Closed on
Mar 9, 2023
Sold by
Johnson Robert R and Johnson Patricia A
Bought by
Beaumont Ross Colby
Create a Home Valuation Report for This Property
The Home Valuation Report is an in-depth analysis detailing your home's value as well as a comparison with similar homes in the area
Purchase History
We collect this data history from publicly available records. To have your information removed, we recommend requesting removal directly through your county’s website.
| Date | Buyer | Sale Price | Title Company |
|---|---|---|---|
| Gumhp Llc | -- | None Listed On Document | |
| Guh 107 Llc | -- | None Listed On Document | |
| Ross Colby Beaumont | $115,000 | None Listed On Document | |
| Beaumont Ross Colby | -- | -- |
Source: Public Records
Tax History
| Year | Tax Paid | Tax Assessment Tax Assessment Total Assessment is a certain percentage of the fair market value that is determined by local assessors to be the total taxable value of land and additions on the property. | Land | Improvement |
|---|---|---|---|---|
| 2025 | $691 | $28,600 | $5,300 | $23,300 |
| 2024 | $543 | $19,600 | $5,300 | $14,300 |
| 2023 | $462 | $19,350 | $5,300 | $14,050 |
| 2022 | $375 | $17,700 | $3,600 | $14,100 |
| 2021 | $400 | $19,150 | $2,350 | $16,800 |
| 2020 | $405 | $19,000 | $2,350 | $16,650 |
| 2019 | $407 | $18,200 | $0 | $0 |
| 2018 | $377 | $17,650 | $2,150 | $15,500 |
| 2017 | $360 | $17,350 | $2,150 | $15,200 |
| 2016 | $333 | $16,100 | $2,150 | $13,950 |
| 2015 | $299 | $14,000 | $2,150 | $11,850 |
| 2014 | $252 | $12,850 | $2,100 | $10,750 |
| 2013 | $240 | $11,950 | $2,100 | $9,850 |
Source: Public Records
Map
Nearby Homes
Your Personal Tour Guide
Ask me questions while you tour the home.