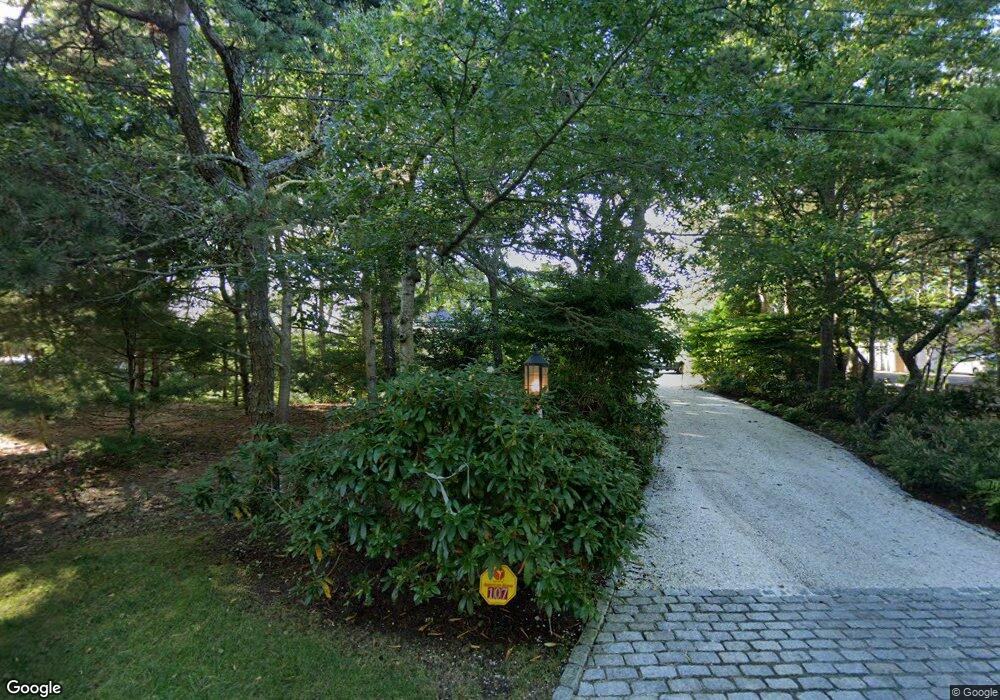
107 Farm Ln South Dennis, MA 02660
West Dennis NeighborhoodEstimated Value: $1,093,000 - $4,690,657
3
Beds
3
Baths
2,155
Sq Ft
$1,342/Sq Ft
Est. Value
About This Home
This home is located at 107 Farm Ln, South Dennis, MA 02660 and is currently estimated at $2,891,829, approximately $1,341 per square foot. 107 Farm Ln is a home located in Barnstable County with nearby schools including Dennis-Yarmouth Regional High School and St. Pius X. School.
Ownership History
Date
Name
Owned For
Owner Type
Purchase Details
Closed on
Oct 21, 2021
Sold by
Delagi R Gregory R and Delagi Beth W
Bought by
Delagi Family Prop Llc
Current Estimated Value
Purchase Details
Closed on
Aug 5, 2005
Sold by
Simonelli Joseph E
Bought by
Delagi Beth W and Delagi Gregory R
Purchase Details
Closed on
Nov 2, 2000
Sold by
Burch-Frisby Corp
Bought by
Simonelli Joseph E
Home Financials for this Owner
Home Financials are based on the most recent Mortgage that was taken out on this home.
Original Mortgage
$1,000,000
Interest Rate
7.83%
Mortgage Type
Purchase Money Mortgage
Create a Home Valuation Report for This Property
The Home Valuation Report is an in-depth analysis detailing your home's value as well as a comparison with similar homes in the area
Home Values in the Area
Average Home Value in this Area
Purchase History
| Date | Buyer | Sale Price | Title Company |
|---|---|---|---|
| Delagi Family Prop Llc | -- | None Available | |
| Delagi Beth W | $1,660,000 | -- | |
| Simonelli Joseph E | $1,275,000 | -- |
Source: Public Records
Mortgage History
| Date | Status | Borrower | Loan Amount |
|---|---|---|---|
| Previous Owner | Simonelli Joseph E | $1,000,000 |
Source: Public Records
Tax History Compared to Growth
Tax History
| Year | Tax Paid | Tax Assessment Tax Assessment Total Assessment is a certain percentage of the fair market value that is determined by local assessors to be the total taxable value of land and additions on the property. | Land | Improvement |
|---|---|---|---|---|
| 2025 | $19,607 | $4,528,100 | $941,400 | $3,586,700 |
| 2024 | $19,584 | $4,461,000 | $905,300 | $3,555,700 |
| 2023 | $18,134 | $3,883,100 | $832,700 | $3,050,400 |
| 2022 | $16,558 | $2,956,700 | $750,100 | $2,206,600 |
| 2021 | $15,433 | $2,559,300 | $769,500 | $1,789,800 |
| 2020 | $14,910 | $2,444,200 | $735,400 | $1,708,800 |
| 2019 | $14,965 | $2,425,400 | $721,000 | $1,704,400 |
| 2018 | $15,997 | $2,523,200 | $877,800 | $1,645,400 |
| 2017 | $15,517 | $2,523,100 | $877,700 | $1,645,400 |
| 2016 | $15,541 | $2,380,000 | $973,400 | $1,406,600 |
| 2015 | $15,232 | $2,380,000 | $973,400 | $1,406,600 |
| 2014 | $15,113 | $2,380,000 | $973,400 | $1,406,600 |
Source: Public Records
Map
Nearby Homes
- 295 Main St
- 293 Main St
- 293 Main St
- 30 Captain Nickerson Ln
- 401 Main St Unit 201
- 401 Main St Unit 101
- 31 Duck Pond Rd
- 26 Willowford Rd
- 18 Curve Hill Rd
- 3 Pinefield Ln
- 3 Jennifer Ln
- 26 Center St
- 23 Fairwood Rd
- 8 Viking Rock Rd
- 29 Highland St
- 21 Green Way
- 32 Half Way
- 91 Chipping Green Cir
- 18 Rangeley Ln
- 18 Rangely Ln