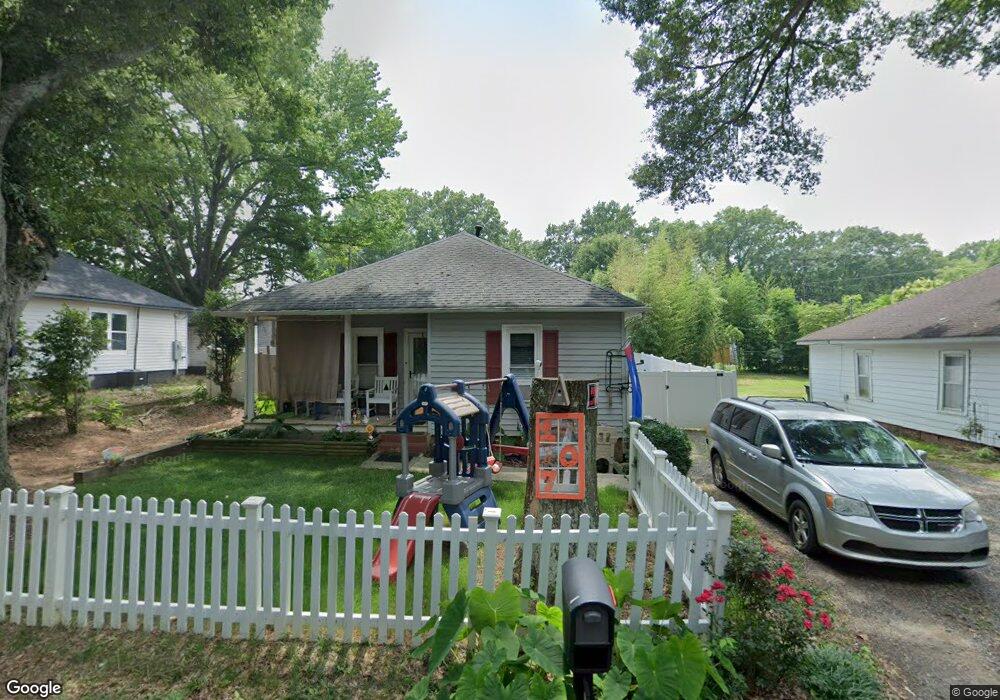
107 Fulton Dr Kings Mountain, NC 28086
Estimated Value: $117,000 - $187,000
2
Beds
1
Bath
1,005
Sq Ft
$151/Sq Ft
Est. Value
About This Home
This home is located at 107 Fulton Dr, Kings Mountain, NC 28086 and is currently estimated at $151,324, approximately $150 per square foot. 107 Fulton Dr is a home located in Cleveland County with nearby schools including West Elementary School, Kings Mountain Middle, and Kings Mountain Intermediate School.
Ownership History
Date
Name
Owned For
Owner Type
Purchase Details
Closed on
Sep 21, 2018
Sold by
Skk Properties Inc
Bought by
Bolding Stephanie
Current Estimated Value
Home Financials for this Owner
Home Financials are based on the most recent Mortgage that was taken out on this home.
Original Mortgage
$58,200
Outstanding Balance
$50,649
Interest Rate
4.5%
Mortgage Type
New Conventional
Estimated Equity
$100,675
Purchase Details
Closed on
May 31, 2012
Sold by
Wright Leonard G and Wright Ann Marie S
Bought by
Hometrust Bank
Purchase Details
Closed on
Sep 26, 2006
Sold by
Farris Amber and Farris Grady D
Bought by
Wright Leonard G and Wright Ann Marie
Home Financials for this Owner
Home Financials are based on the most recent Mortgage that was taken out on this home.
Original Mortgage
$52,000
Interest Rate
6.48%
Mortgage Type
FHA
Create a Home Valuation Report for This Property
The Home Valuation Report is an in-depth analysis detailing your home's value as well as a comparison with similar homes in the area
Home Values in the Area
Average Home Value in this Area
Purchase History
| Date | Buyer | Sale Price | Title Company |
|---|---|---|---|
| Bolding Stephanie | $60,000 | None Available | |
| Hometrust Bank | $20,240 | None Available | |
| Wright Leonard G | $52,500 | None Available |
Source: Public Records
Mortgage History
| Date | Status | Borrower | Loan Amount |
|---|---|---|---|
| Open | Bolding Stephanie | $58,200 | |
| Previous Owner | Wright Leonard G | $52,000 |
Source: Public Records
Tax History Compared to Growth
Tax History
| Year | Tax Paid | Tax Assessment Tax Assessment Total Assessment is a certain percentage of the fair market value that is determined by local assessors to be the total taxable value of land and additions on the property. | Land | Improvement |
|---|---|---|---|---|
| 2025 | $757 | $73,900 | $13,275 | $60,625 |
| 2024 | $500 | $40,699 | $13,275 | $27,424 |
| 2023 | $498 | $40,699 | $13,275 | $27,424 |
| 2022 | $477 | $40,699 | $13,275 | $27,424 |
| 2021 | $480 | $40,699 | $13,275 | $27,424 |
| 2020 | $379 | $31,050 | $10,620 | $20,430 |
| 2019 | $379 | $31,050 | $10,620 | $20,430 |
| 2018 | $378 | $31,050 | $10,620 | $20,430 |
| 2017 | $376 | $31,050 | $10,620 | $20,430 |
| 2016 | $376 | $31,050 | $10,620 | $20,430 |
| 2015 | $368 | $31,162 | $4,672 | $26,490 |
| 2014 | $368 | $31,162 | $4,672 | $26,490 |
Source: Public Records
Map
Nearby Homes
- 112 Fulton Dr
- 804 Lee St
- 0 Southridge Dr Unit CAR4298120
- 430 Fulton Dr
- 245 Paige Rd
- 230 Paige Rd
- 218 Paige Rd
- 417 Phifer Rd
- 227 Paige Rd
- 149 Parker Claire Ln
- 212 Paige Rd
- 123 Parker Claire Ln
- 143 Parker Claire Ln
- 137 Parker Claire Ln
- 157 Parker Claire Ln
- 104 Parker Claire Ln
- 207 Parker Claire Ln
- 219 Parker Claire Ln
- 442 Phifer Rd
- 419 Brinkley Dr