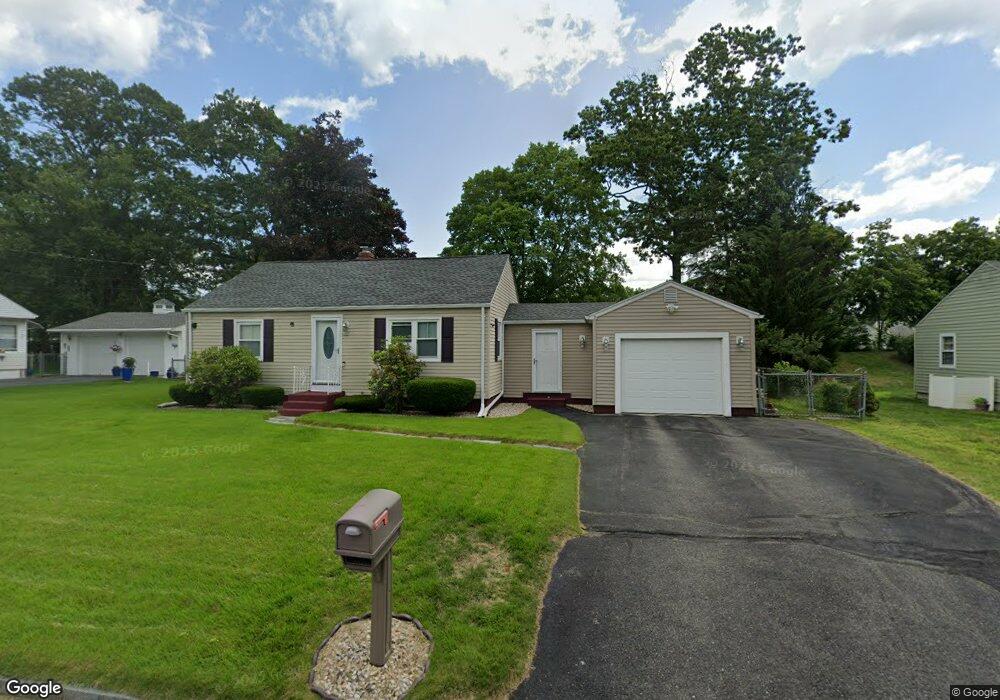
107 Granger St Springfield, MA 01119
Sixteen Acres NeighborhoodEstimated Value: $307,000 - $353,000
3
Beds
1
Bath
1,470
Sq Ft
$220/Sq Ft
Est. Value
About This Home
This home is located at 107 Granger St, Springfield, MA 01119 and is currently estimated at $323,500, approximately $220 per square foot. 107 Granger St is a home located in Hampden County with nearby schools including Glickman Elementary, John J Duggan Middle, and Springfield High School of Science and Technology.
Ownership History
Date
Name
Owned For
Owner Type
Purchase Details
Closed on
Nov 26, 2024
Sold by
Maurer Kevin
Bought by
Maurer Kevin and Zhirnova Inna
Current Estimated Value
Purchase Details
Closed on
Feb 10, 2011
Sold by
New Opportunity Rt and Kirchner
Bought by
Maurer Kevin
Home Financials for this Owner
Home Financials are based on the most recent Mortgage that was taken out on this home.
Original Mortgage
$117,600
Interest Rate
4.88%
Mortgage Type
Purchase Money Mortgage
Purchase Details
Closed on
Jun 8, 2010
Sold by
Cahill Richard W and Cahill Mary A
Bought by
New Opportunities Rt and Kirchner
Purchase Details
Closed on
Jun 29, 2001
Sold by
Provost Susan M
Bought by
Cahill Richard W and Cahill Mary A
Purchase Details
Closed on
Feb 24, 1993
Sold by
Fales Stanley H and Fales Doris R
Bought by
Provost Susan M
Create a Home Valuation Report for This Property
The Home Valuation Report is an in-depth analysis detailing your home's value as well as a comparison with similar homes in the area
Home Values in the Area
Average Home Value in this Area
Purchase History
| Date | Buyer | Sale Price | Title Company |
|---|---|---|---|
| Maurer Kevin | -- | None Available | |
| Maurer Kevin | -- | None Available | |
| Maurer Kevin | $147,000 | -- | |
| New Opportunities Rt | $6,228 | -- | |
| Cahill Richard W | $81,000 | -- | |
| Provost Susan M | $65,000 | -- | |
| Maurer Kevin | $147,000 | -- | |
| New Opportunities Rt | $6,228 | -- | |
| Cahill Richard W | $81,000 | -- | |
| Provost Susan M | $65,000 | -- |
Source: Public Records
Mortgage History
| Date | Status | Borrower | Loan Amount |
|---|---|---|---|
| Previous Owner | Provost Susan M | $117,600 |
Source: Public Records
Tax History
| Year | Tax Paid | Tax Assessment Tax Assessment Total Assessment is a certain percentage of the fair market value that is determined by local assessors to be the total taxable value of land and additions on the property. | Land | Improvement |
|---|---|---|---|---|
| 2025 | $4,108 | $262,000 | $51,900 | $210,100 |
| 2024 | $4,063 | $253,000 | $51,900 | $201,100 |
| 2023 | $4,491 | $263,400 | $49,400 | $214,000 |
| 2022 | $4,058 | $215,600 | $49,400 | $166,200 |
| 2021 | $3,772 | $199,600 | $44,900 | $154,700 |
| 2020 | $3,711 | $190,000 | $44,900 | $145,100 |
| 2019 | $3,635 | $184,700 | $44,900 | $139,800 |
| 2018 | $3,566 | $181,200 | $44,900 | $136,300 |
| 2017 | $3,326 | $169,200 | $44,800 | $124,400 |
| 2016 | $3,165 | $161,000 | $44,800 | $116,200 |
| 2015 | $2,984 | $151,700 | $44,800 | $106,900 |
Source: Public Records
Map
Nearby Homes
- 97 Granger St
- 115 Granger St
- 112 Maebeth St
- 106 Maebeth St
- 122 Maebeth St
- 108 Granger St
- 87 Granger St
- 125 Granger St
- 125 Granger St Unit 1
- 116 Granger St
- 98 Maebeth St
- 132 Maebeth St
- 88 Granger St
- 126 Granger St
- 92 Maebeth St
- 97 Denwall Dr
- 445 Sunrise Terrace
- 77 Granger St
- 115 Denwall Dr
- 140 Maebeth St
Your Personal Tour Guide
Ask me questions while you tour the home.