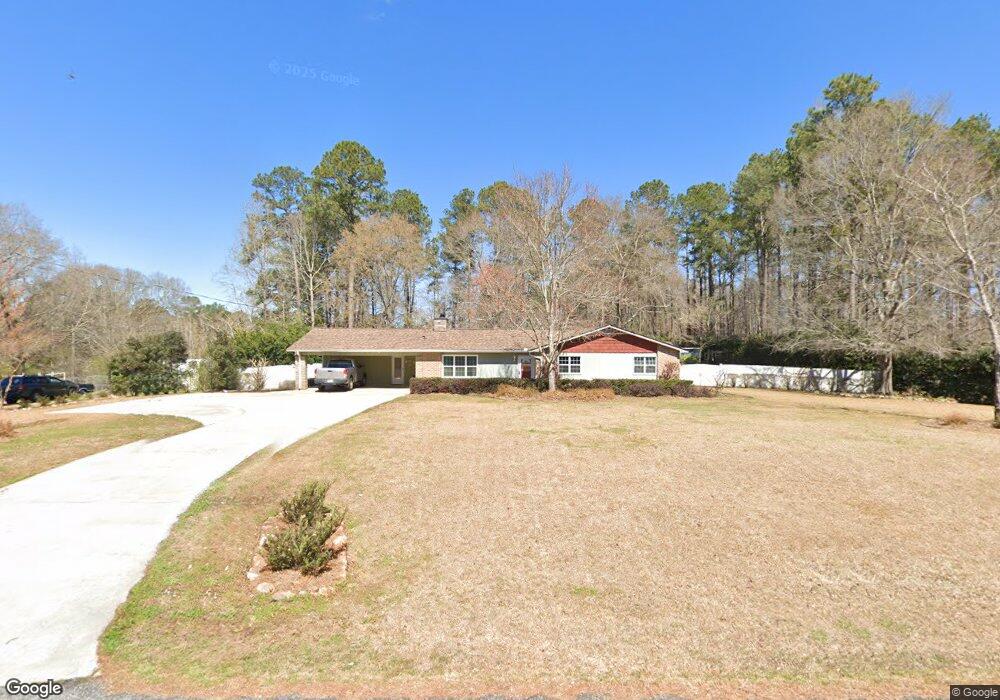
107 Hazel Way Lagrange, GA 30241
Estimated Value: $248,000 - $307,000
3
Beds
2
Baths
2,175
Sq Ft
$129/Sq Ft
Est. Value
About This Home
This home is located at 107 Hazel Way, Lagrange, GA 30241 and is currently estimated at $281,611, approximately $129 per square foot. 107 Hazel Way is a home located in Troup County with nearby schools including Callaway Elementary School, Hogansville Elementary School, and Callaway Middle School.
Ownership History
Date
Name
Owned For
Owner Type
Purchase Details
Closed on
Jun 2, 1997
Sold by
Benjamin Youmans T
Bought by
Mary Hutto C and Mary Ann
Current Estimated Value
Purchase Details
Closed on
Jul 9, 1996
Sold by
Dr Ben Youmans
Bought by
Benjamin Youmans T
Purchase Details
Closed on
Mar 25, 1996
Sold by
Youmans B
Bought by
Dr Ben Youmans
Purchase Details
Closed on
Apr 19, 1993
Sold by
Thaddeus B Youmans
Bought by
Youmans B
Purchase Details
Closed on
Mar 25, 1980
Sold by
Robert A House
Bought by
Thaddeus B Youmans
Purchase Details
Closed on
Mar 26, 1976
Sold by
Marion Foster and Marion Fomby W
Bought by
Robert A House
Purchase Details
Closed on
Aug 20, 1975
Sold by
Daniel Lumber Co
Bought by
Marion Foster and Marion Fomby W
Purchase Details
Closed on
Aug 1, 1975
Sold by
Joe C Thomas
Bought by
Daniel Lumber Co
Purchase Details
Closed on
Jan 1, 1973
Bought by
Joe C Thomas
Create a Home Valuation Report for This Property
The Home Valuation Report is an in-depth analysis detailing your home's value as well as a comparison with similar homes in the area
Purchase History
| Date | Buyer | Sale Price | Title Company |
|---|---|---|---|
| Mary Hutto C | $70,000 | -- | |
| Benjamin Youmans T | -- | -- | |
| Dr Ben Youmans | -- | -- | |
| Youmans B | $55,000 | -- | |
| Thaddeus B Youmans | $41,300 | -- | |
| Robert A House | -- | -- | |
| Marion Foster | -- | -- | |
| Daniel Lumber Co | -- | -- | |
| Joe C Thomas | -- | -- |
Source: Public Records
Tax History
| Year | Tax Paid | Tax Assessment Tax Assessment Total Assessment is a certain percentage of the fair market value that is determined by local assessors to be the total taxable value of land and additions on the property. | Land | Improvement |
|---|---|---|---|---|
| 2025 | $2,556 | $97,140 | $10,000 | $87,140 |
| 2024 | $2,485 | $93,100 | $10,000 | $83,100 |
| 2023 | $2,496 | $93,504 | $10,000 | $83,504 |
| 2022 | $2,373 | $87,024 | $10,000 | $77,024 |
| 2021 | $1,862 | $63,716 | $8,000 | $55,716 |
| 2020 | $1,862 | $63,716 | $8,000 | $55,716 |
| 2019 | $1,446 | $49,920 | $4,800 | $45,120 |
| 2018 | $1,315 | $45,592 | $4,000 | $41,592 |
| 2017 | $1,315 | $45,592 | $4,000 | $41,592 |
| 2016 | $1,285 | $44,602 | $4,000 | $40,602 |
| 2015 | $1,288 | $44,602 | $4,000 | $40,602 |
| 2014 | $1,225 | $42,466 | $4,000 | $38,466 |
| 2013 | -- | $42,724 | $4,000 | $38,724 |
Source: Public Records
Map
Nearby Homes
- 10 Whitfield Rd
- SMOKEMONT Smokemont Dr
- 883 Hammett Rd
- 119 Sir Lancelot St
- 789 Hammett Rd
- 124 Woodridge Cir
- 300 Old Pond Rd
- 200 Freshwater Ct Unit 37
- 234 River Meadow Dr
- 202 Freshwater Ct Unit E36
- 202 Freshwater Ct
- 402 Sweetwood Ct Unit LOT 2
- 204 Freshwater Ct
- 206 Freshwater Ct Unit 34E
- 206 Freshwater Ct
- 200 River Meadow Dr
- 124 Shenandoah Ln
- 114 Shenandoah Ln
- 105 Ridgefield Dr
- 106 Shenandoah Ln Unit 26E
Your Personal Tour Guide
Ask me questions while you tour the home.