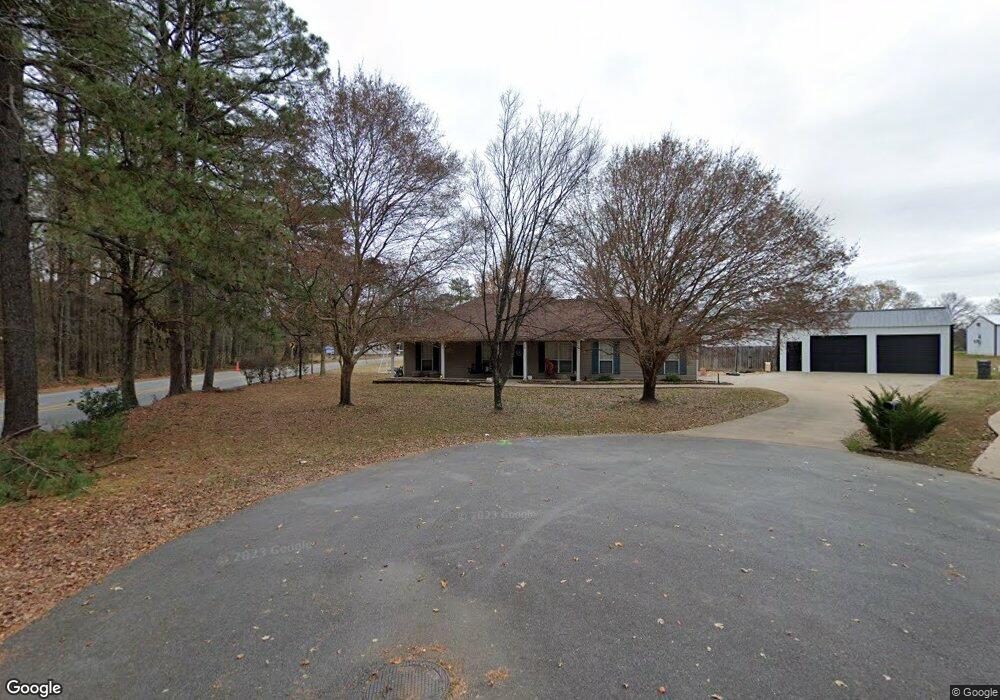
107 Highlander Cir Benton, AR 72015
Estimated Value: $209,000 - $236,205
Studio
2
Baths
1,565
Sq Ft
$142/Sq Ft
Est. Value
About This Home
This home is located at 107 Highlander Cir, Benton, AR 72015 and is currently estimated at $222,551, approximately $142 per square foot. 107 Highlander Cir is a home located in Saline County with nearby schools including Westbrook Elementary School, Harmony Grove Middle School, and Harmony Grove High School.
Ownership History
Date
Name
Owned For
Owner Type
Purchase Details
Closed on
Jan 11, 2019
Sold by
Vandorn Michael R
Bought by
Self David Joseph Keith and Koba Jennifer N
Current Estimated Value
Home Financials for this Owner
Home Financials are based on the most recent Mortgage that was taken out on this home.
Original Mortgage
$125,130
Outstanding Balance
$110,457
Interest Rate
4.8%
Mortgage Type
New Conventional
Estimated Equity
$112,094
Purchase Details
Closed on
Oct 4, 2005
Sold by
Centex Home Equity Co Llc
Bought by
Vandorn Michael R
Home Financials for this Owner
Home Financials are based on the most recent Mortgage that was taken out on this home.
Original Mortgage
$84,000
Interest Rate
6.04%
Mortgage Type
New Conventional
Purchase Details
Closed on
Jul 15, 2005
Sold by
Lewis Keith S and Lewis Lisa J
Bought by
Centex Home Equity Company Llc
Purchase Details
Closed on
Oct 29, 2001
Bought by
Lewis
Purchase Details
Closed on
May 31, 2001
Bought by
Replat Lots 1-5
Create a Home Valuation Report for This Property
The Home Valuation Report is an in-depth analysis detailing your home's value as well as a comparison with similar homes in the area
Home Values in the Area
Average Home Value in this Area
Purchase History
| Date | Buyer | Sale Price | Title Company |
|---|---|---|---|
| Self David Joseph Keith | $129,000 | Lenders Title Company | |
| Vandorn Michael R | $105,000 | -- | |
| Centex Home Equity Company Llc | $98,000 | -- | |
| Lewis | $94,000 | -- | |
| Ferguson Bi | -- | -- | |
| Replat Lots 1-5 | -- | -- |
Source: Public Records
Mortgage History
| Date | Status | Borrower | Loan Amount |
|---|---|---|---|
| Open | Self David Joseph Keith | $125,130 | |
| Previous Owner | Vandorn Michael R | $84,000 |
Source: Public Records
Tax History
| Year | Tax Paid | Tax Assessment Tax Assessment Total Assessment is a certain percentage of the fair market value that is determined by local assessors to be the total taxable value of land and additions on the property. | Land | Improvement |
|---|---|---|---|---|
| 2025 | $2,087 | $38,771 | $5,700 | $33,071 |
| 2024 | $1,746 | $36,038 | $5,700 | $30,338 |
| 2023 | $1,528 | $36,038 | $5,700 | $30,338 |
| 2022 | $1,499 | $36,038 | $5,700 | $30,338 |
| 2021 | $1,422 | $26,884 | $4,400 | $22,484 |
| 2020 | $1,296 | $24,760 | $4,400 | $20,360 |
| 2019 | $1,227 | $24,760 | $4,400 | $20,360 |
| 2018 | $1,252 | $24,760 | $4,400 | $20,360 |
| 2017 | $1,202 | $24,760 | $4,400 | $20,360 |
| 2016 | $1,333 | $23,590 | $4,400 | $19,190 |
| 2015 | $1,333 | $23,590 | $4,400 | $19,190 |
| 2014 | $1,136 | $23,590 | $4,400 | $19,190 |
Source: Public Records
Map
Nearby Homes
- 306 Meadow Creek Dr
- 350 Meadow Creek Dr
- 370 Meadow Creek Dr
- 112 Kee Cove
- 5060 N Highway 229
- 815 Graham Rd
- 810 Troutman Rd
- 114 Hayes Haskell St
- 1019 Grand Ave
- 401 Aden Ave
- 1310 Caroline Cove
- 1445 Pine
- 000 Desi Ln
- 5017 Rolling Meadow Loop
- 4001 Rolling Meadow Ln
- 529 Dodson Creek Rd
- 109 Riveria Cove
- 0000 Deer Creek Rd
- Oklahoma Inn Rd
- 122 Harmony Village Dr
- 107 Highlander Dr
- 105 Highlander Cir
- 4012 S Highway 229
- 101 Highlander Cir
- 4011 S Highway 229
- 104 Timber Lake Dr
- 104 Timberlake Dr
- 106 Timber Lake Dr
- 3925 S Highway 229
- 108 Timber Lake Dr
- 109 Timber Lake Dr
- 109 Timberlake Dr
- 114 Meadow Creek Ct
- 416 Hickory Grove St
- 112 Meadow Creek Ct
- 3914 S Highway 229
- 112 Meadow Creek Ct
- 216 Meadow Creek Ct
- 110 Timberlake Dr
- 110 Timber Lake Dr
Your Personal Tour Guide
Ask me questions while you tour the home.