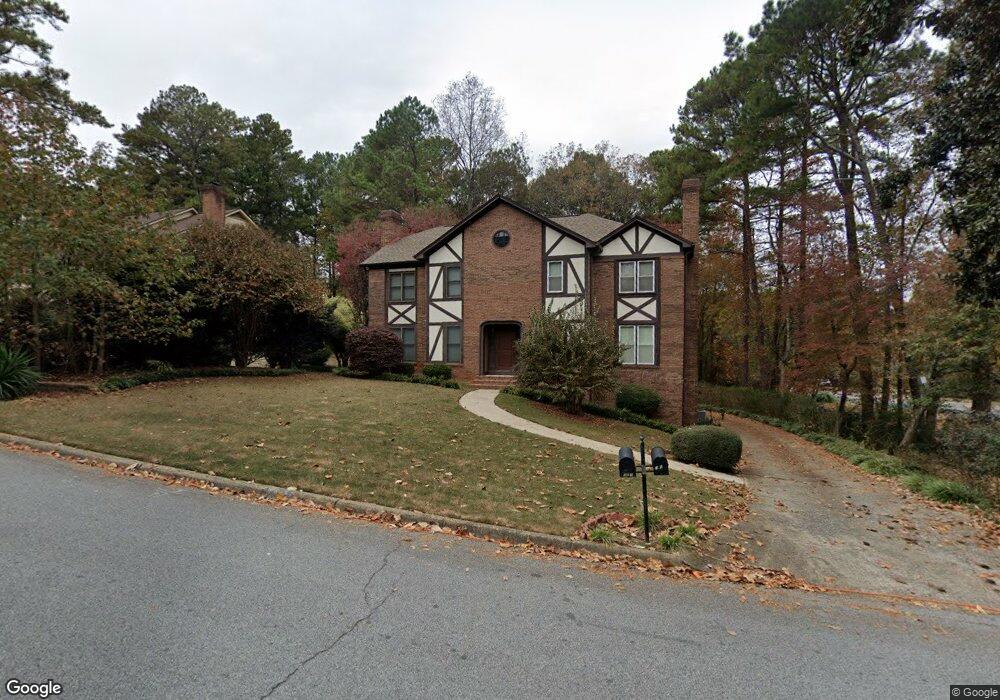
107 Hunters Cove Roswell, GA 30076
Estimated Value: $366,000 - $429,000
3
Beds
3
Baths
1,506
Sq Ft
$259/Sq Ft
Est. Value
About This Home
This home is located at 107 Hunters Cove, Roswell, GA 30076 and is currently estimated at $390,644, approximately $259 per square foot. 107 Hunters Cove is a home located in Fulton County with nearby schools including Hillside Elementary School, Haynes Bridge Middle School, and Centennial High School.
Ownership History
Date
Name
Owned For
Owner Type
Purchase Details
Closed on
Nov 22, 2011
Sold by
Federal National Mortgage Association
Bought by
Martin Nikki L
Current Estimated Value
Home Financials for this Owner
Home Financials are based on the most recent Mortgage that was taken out on this home.
Original Mortgage
$129,105
Outstanding Balance
$88,588
Interest Rate
4.15%
Mortgage Type
New Conventional
Estimated Equity
$302,056
Purchase Details
Closed on
Sep 6, 2011
Sold by
Citimortgage Inc
Bought by
Federal National Mtg Associati
Purchase Details
Closed on
Mar 30, 1995
Sold by
Koeplin Andre Bonita E
Bought by
Patel Narendra
Purchase Details
Closed on
Feb 10, 1993
Sold by
R T C
Bought by
Koeplin Andre Bonita R
Home Financials for this Owner
Home Financials are based on the most recent Mortgage that was taken out on this home.
Original Mortgage
$64,100
Interest Rate
7.83%
Mortgage Type
FHA
Create a Home Valuation Report for This Property
The Home Valuation Report is an in-depth analysis detailing your home's value as well as a comparison with similar homes in the area
Home Values in the Area
Average Home Value in this Area
Purchase History
| Date | Buyer | Sale Price | Title Company |
|---|---|---|---|
| Martin Nikki L | $135,000 | -- | |
| Federal National Mtg Associati | -- | -- | |
| Citimortgage Inc | $162,685 | -- | |
| Patel Narendra | $88,000 | -- | |
| Koeplin Andre Bonita R | -- | -- |
Source: Public Records
Mortgage History
| Date | Status | Borrower | Loan Amount |
|---|---|---|---|
| Open | Martin Nikki L | $129,105 | |
| Previous Owner | Koeplin Andre Bonita R | $64,100 | |
| Closed | Patel Narendra | $0 |
Source: Public Records
Tax History Compared to Growth
Tax History
| Year | Tax Paid | Tax Assessment Tax Assessment Total Assessment is a certain percentage of the fair market value that is determined by local assessors to be the total taxable value of land and additions on the property. | Land | Improvement |
|---|---|---|---|---|
| 2025 | $367 | $54,360 | $16,280 | $38,080 |
| 2023 | $2,092 | $74,120 | $12,240 | $61,880 |
| 2022 | $1,950 | $74,120 | $12,240 | $61,880 |
| 2021 | $2,292 | $71,960 | $11,880 | $60,080 |
| 2020 | $2,393 | $73,080 | $12,040 | $61,040 |
| 2019 | $302 | $71,800 | $11,840 | $59,960 |
| 2018 | $1,357 | $65,120 | $14,240 | $50,880 |
| 2017 | $1,403 | $48,080 | $15,000 | $33,080 |
| 2016 | $1,403 | $48,080 | $15,000 | $33,080 |
| 2015 | $1,671 | $48,080 | $15,000 | $33,080 |
| 2014 | $1,474 | $48,080 | $15,000 | $33,080 |
Source: Public Records
Map
Nearby Homes
- 1250 Atherton Park
- 1095 Northpointe Trace
- 245 Spring Ridge Trace
- 260 Spring Ridge Dr
- 650 Lake Forest Ct
- 620 Lake Forest Ct
- 680 Barrington Way
- 515 Forest Place
- 590 Ridgemont Dr
- 105 Laurel Mill Ct
- 9985 Lake Forest Way
- 2642 Long Pointe
- 1020 Summer Oaks Close Unit 4
- 500 Barrington Dr W
- 485 Sheringham Ct
- 9195 Nesbit Lakes Dr
- 115 Ansley Ct
- 105 Hunters Cove
- 115 Hunters Cove
- 120122 Hunters Cove
- 0 Hunters Cove Unit 3250790
- 0 Hunters Cove Unit 7200114
- 0 Hunters Cove Unit 7026305
- 0 Hunters Cove Unit 7010401
- 0 Hunters Cove Unit 8067763
- 0 Hunters Cove Unit 8687755
- 0 Hunters Cove Unit 9
- 117 Hunters Cove
- 125 Hunters Cove
- 112 Hunters Cove
- 120 Hunters Cove
- 127 Hunters Cove
- 100 Hunters Cove
- 110 Hunters Cove
- 102 Hunters Cove
- 130 Hunters Cove
- 120 Spring Ridge Dr